staking
Solana Decentralization Report — July 2026
A data-driven look at Solana validator decentralization for July 2026: stake concentration, geographic and client diversity, and validator movement trends.

Estimated Reading Time: 7 minutes
Summary
This month's Solana Decentralization Report covers 23 key metrics across validator concentration, geographic and client diversity, and stake movement trends for July 2026. Read on for the full breakdown, chart by chart.
Net Stake Change by Validator Size
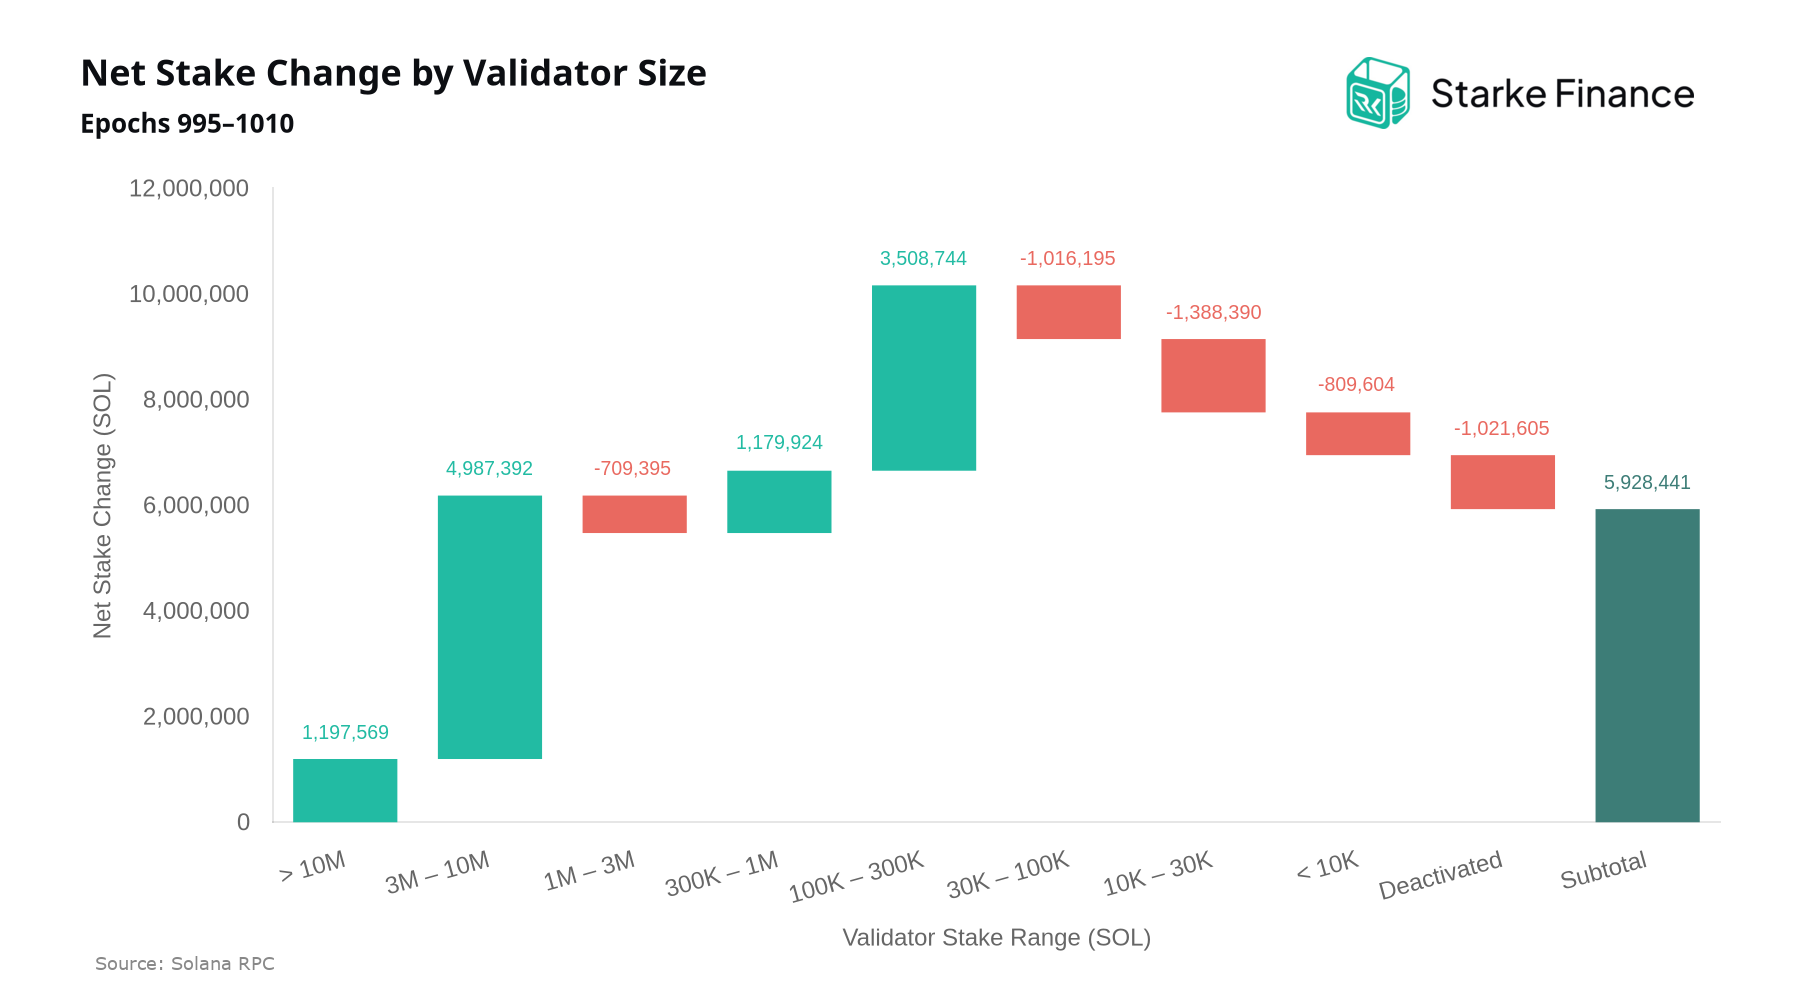
Over the past 15 epochs, roughly 30 days, total net staked SOL rose by approximately 5.9M. The bulk of this growth accrued to validators in the 3M–10M SOL bracket, which captured about 5.0M in net inflows, while the 10K–30K range recorded the largest net outflow at around 1.4M.
Solana Stake Distribution Lorenz Curve
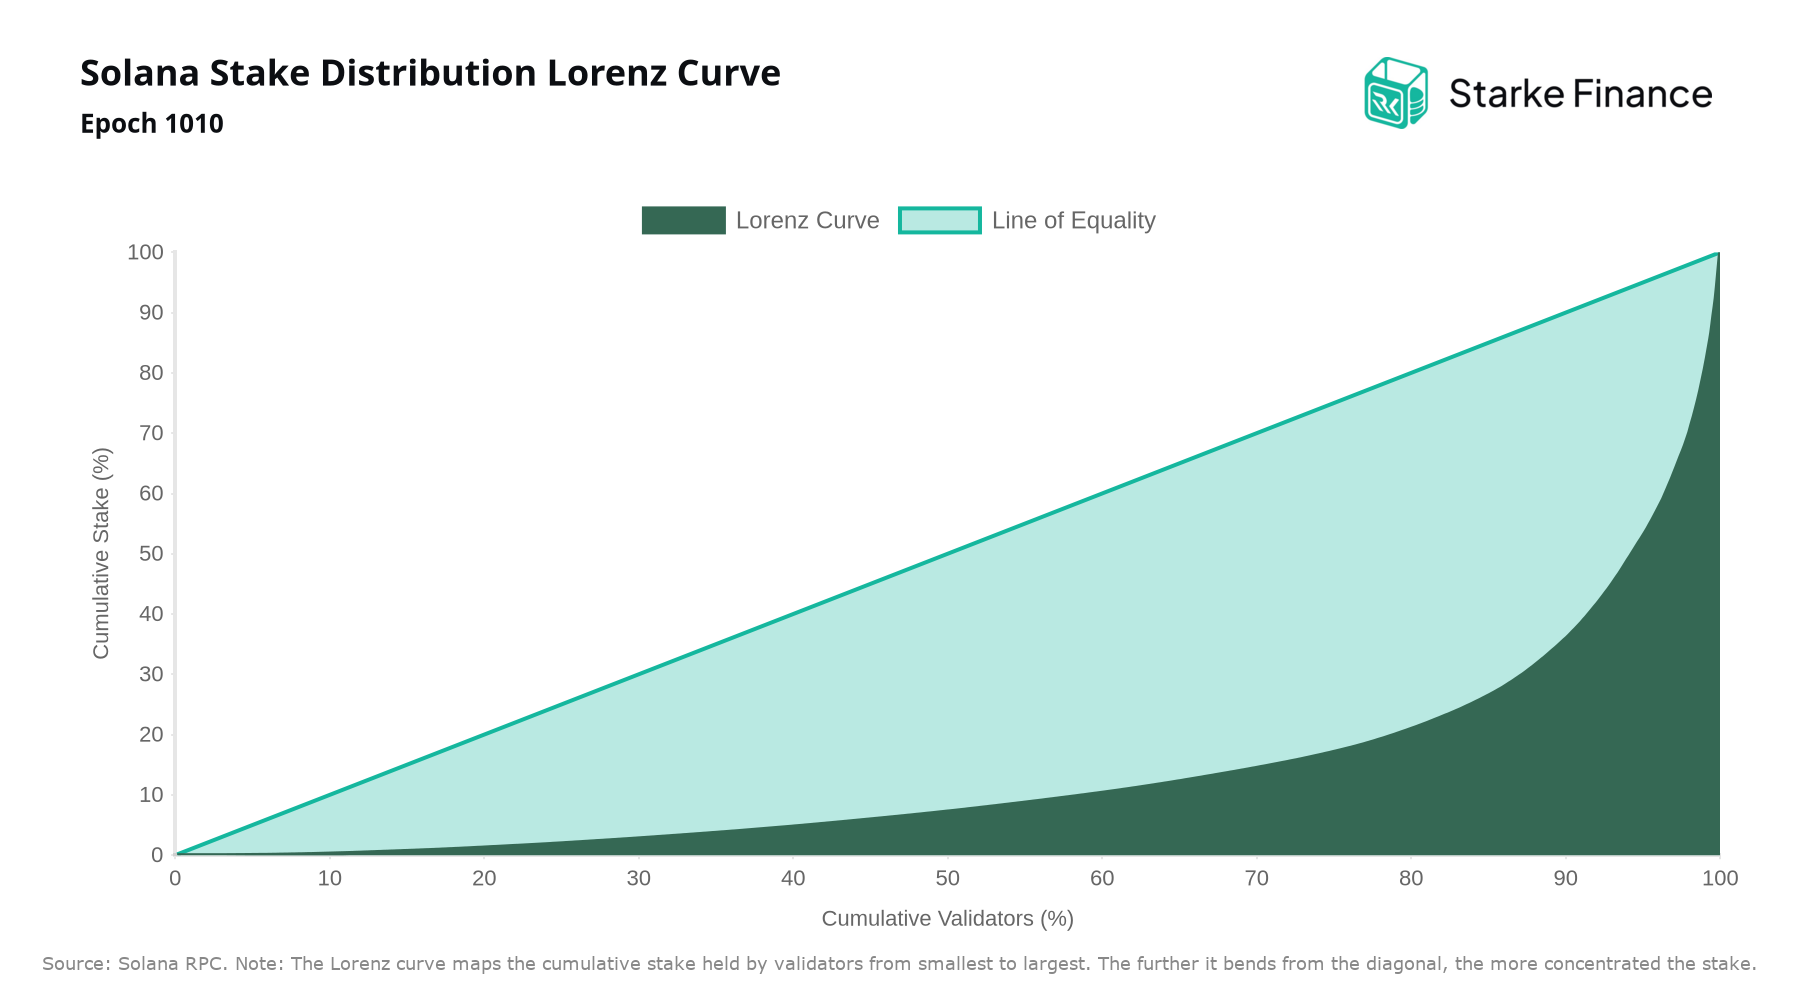
At epoch 1010, Solana's stake distribution Lorenz curve yields a Gini coefficient of 0.7312, indicating that stake remains highly concentrated among a relatively small subset of validators. Over the past 15 epochs, roughly 30 days, the coefficient has moved from 0.7334 to 0.7312 on a scale where 0 represents perfect equality and 1 total concentration.
Solana Stake Control Thresholds
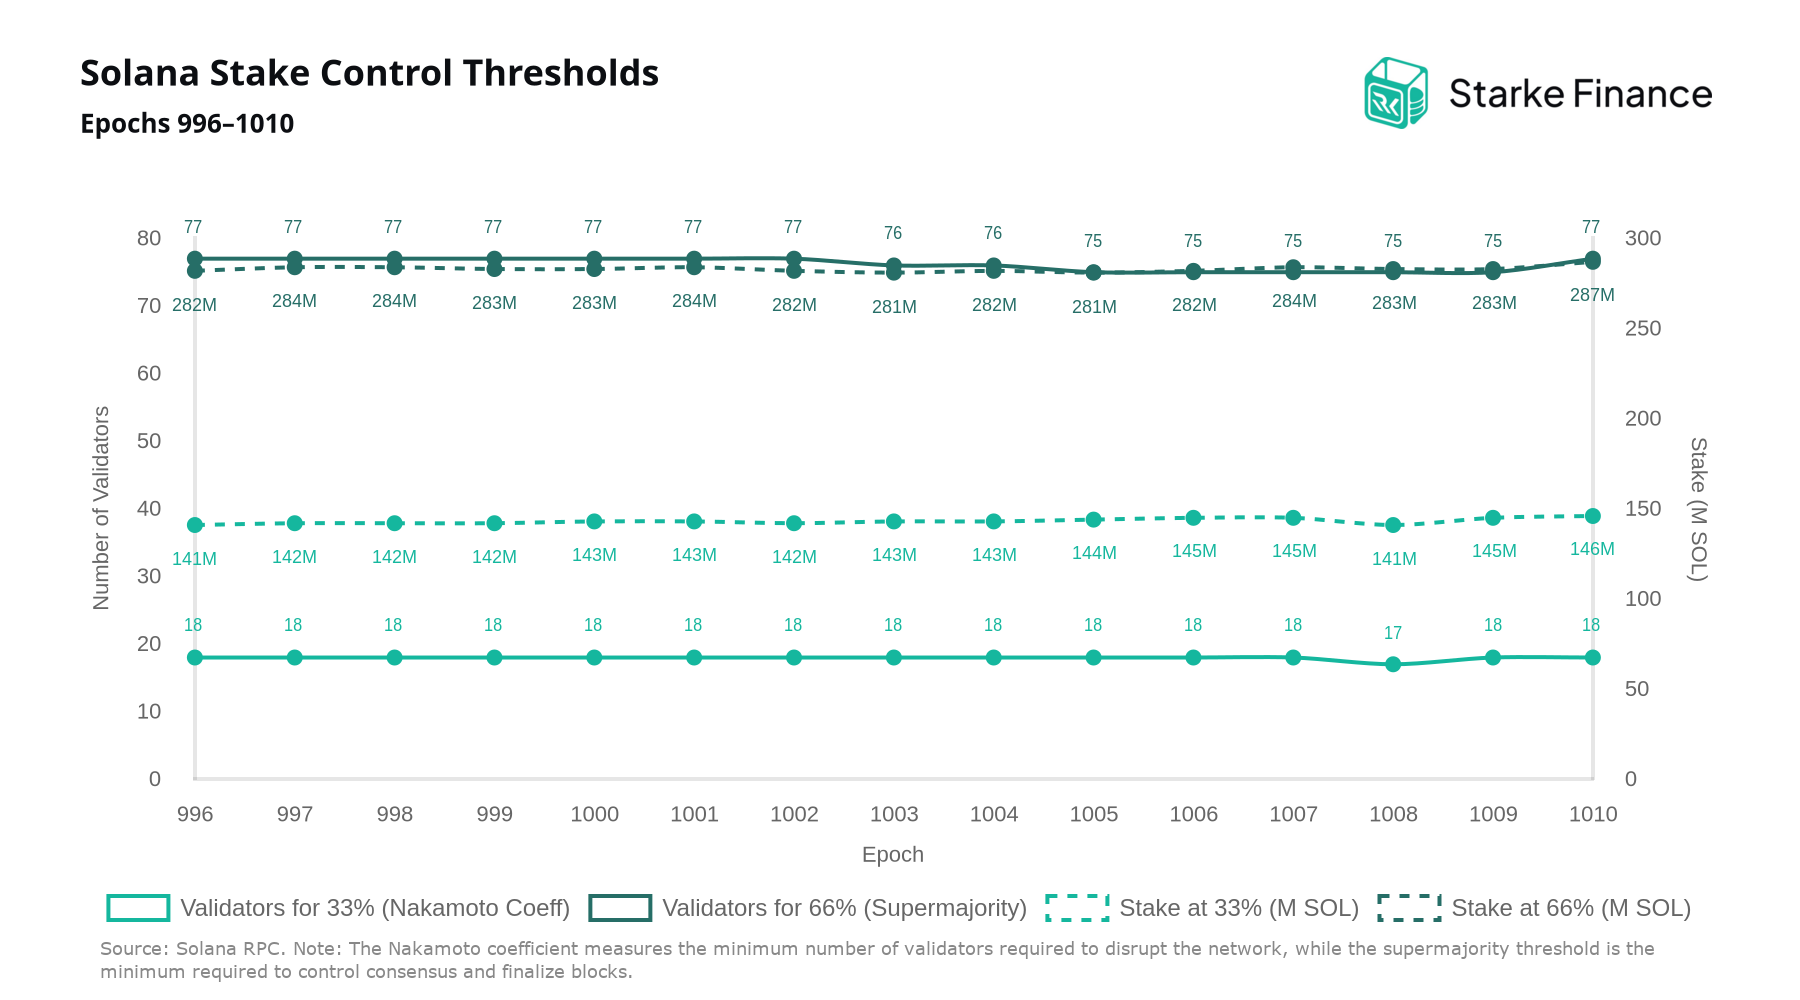
Solana's Nakamoto coefficient held steady at 18 validators over the last 15 epochs, indicating no change in the minimum stake concentration required to halt block production. The supermajority threshold, representing the validator count controlling two-thirds of active stake, likewise remained at 77 over the period.
Stake Concentration: Herfindahl-Hirschman Index (HHI)
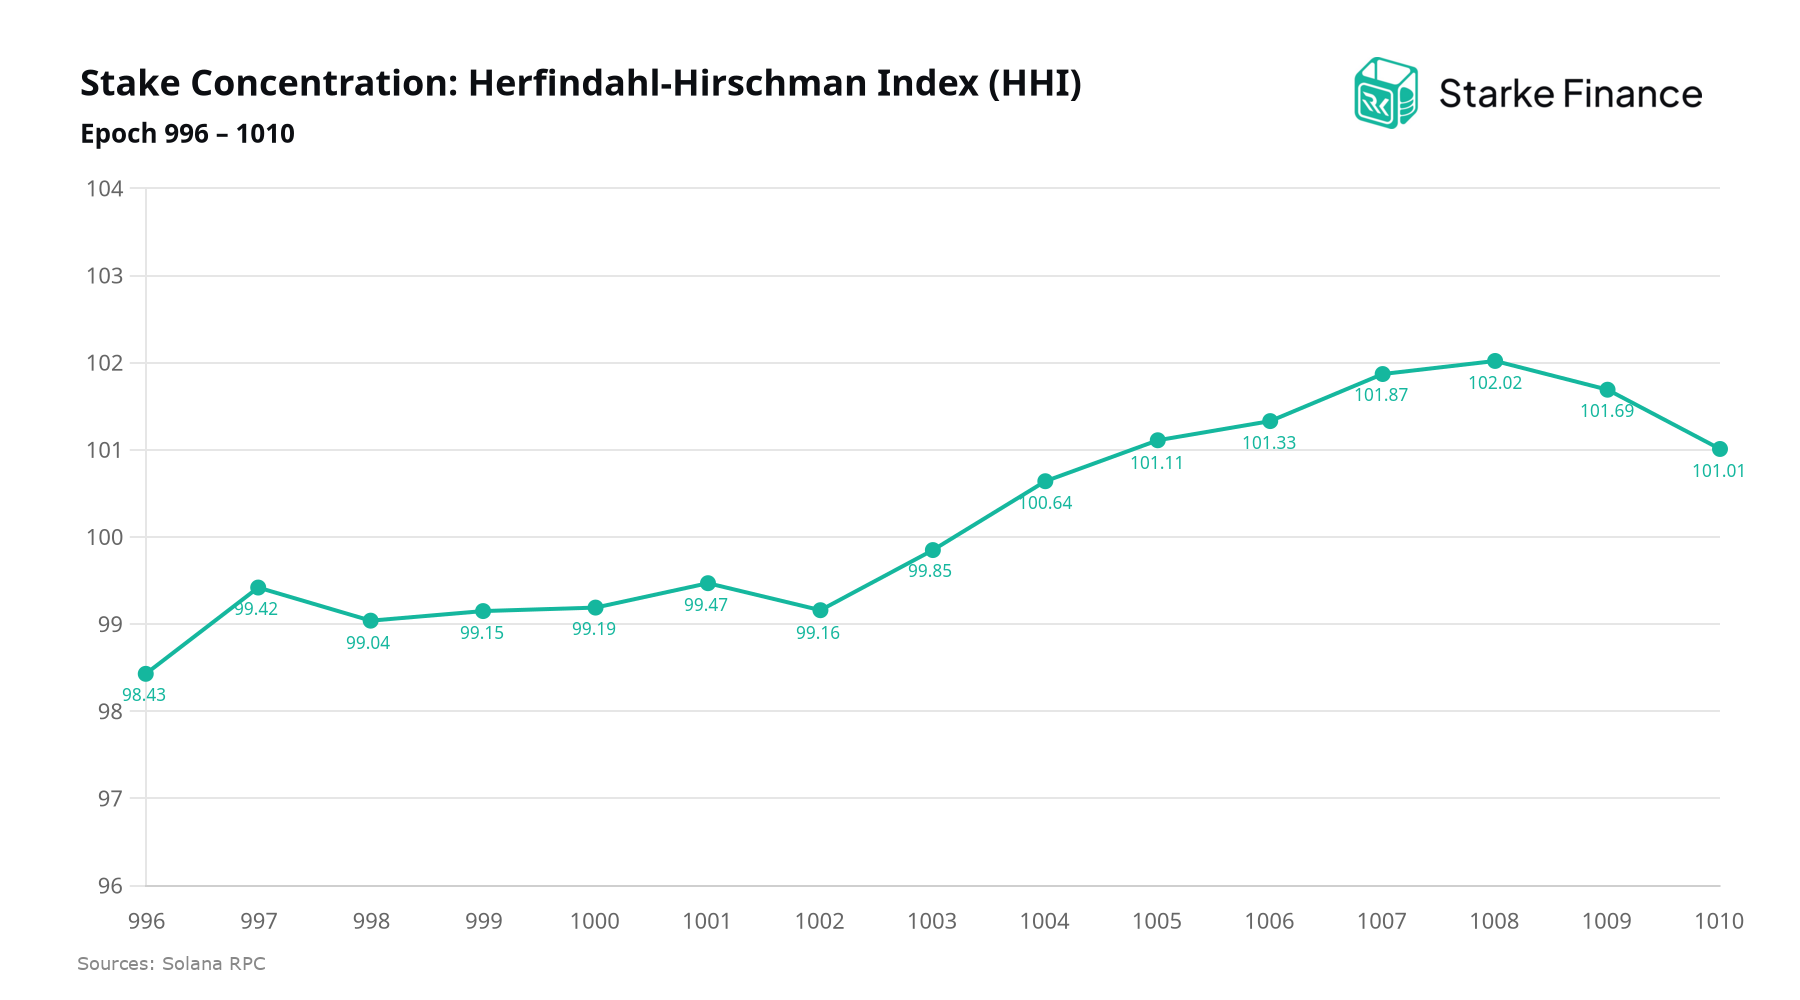
Unlike the Gini coefficient, which measures inequality across the distribution, the HHI reflects effective concentration by capturing how many validators meaningfully contribute to total stake. Between epochs 996 and 1010, the HHI fluctuated within a narrow band of 98.43 to 102.02, pointing to a stable and broad validator base carrying active stake across the network.
Stake Share by Top Staked Validators
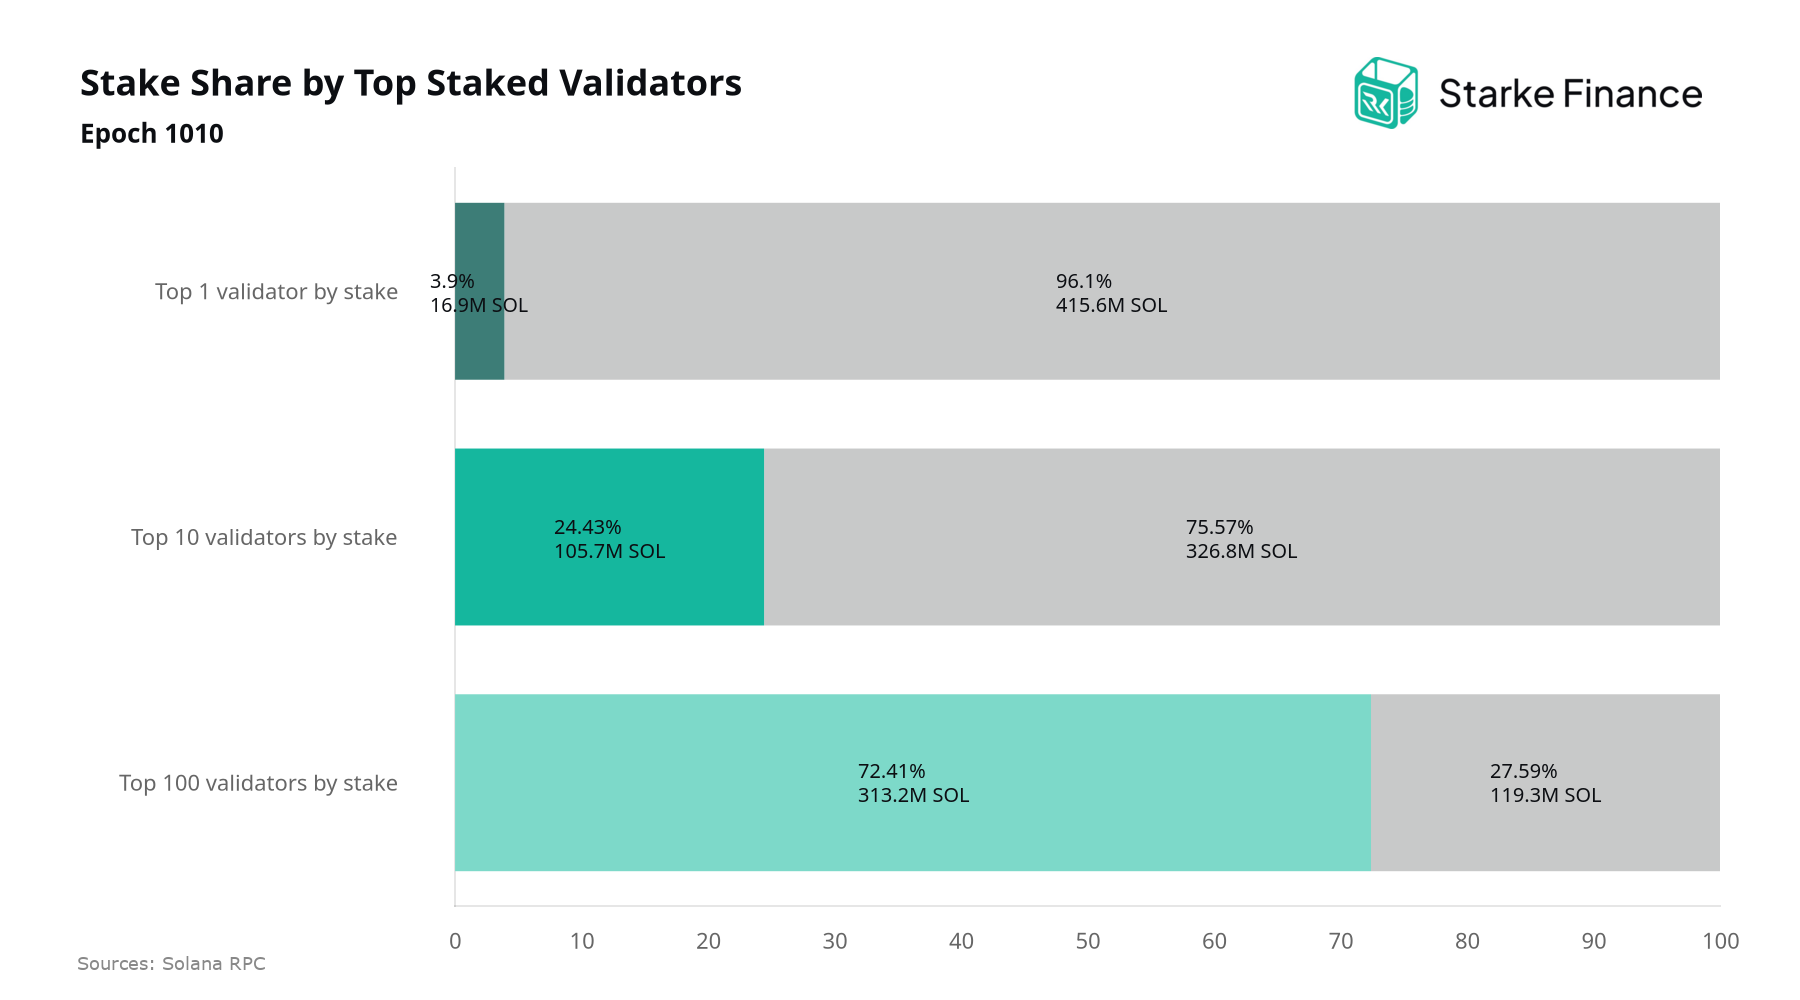
At epoch 1010, the top staked validator holds 3.9% of total stake (16.9M SOL), the top 10 account for 24.43% (105.7M SOL), and the top 100 for 72.41% (313.2M SOL). These concentration bands are a useful lens on network resilience: no single operator approaches a level of unilateral influence, but a meaningful share of consensus weight remains held by a relatively small cohort.
Stake Share by Top Staked Validators per Epoch
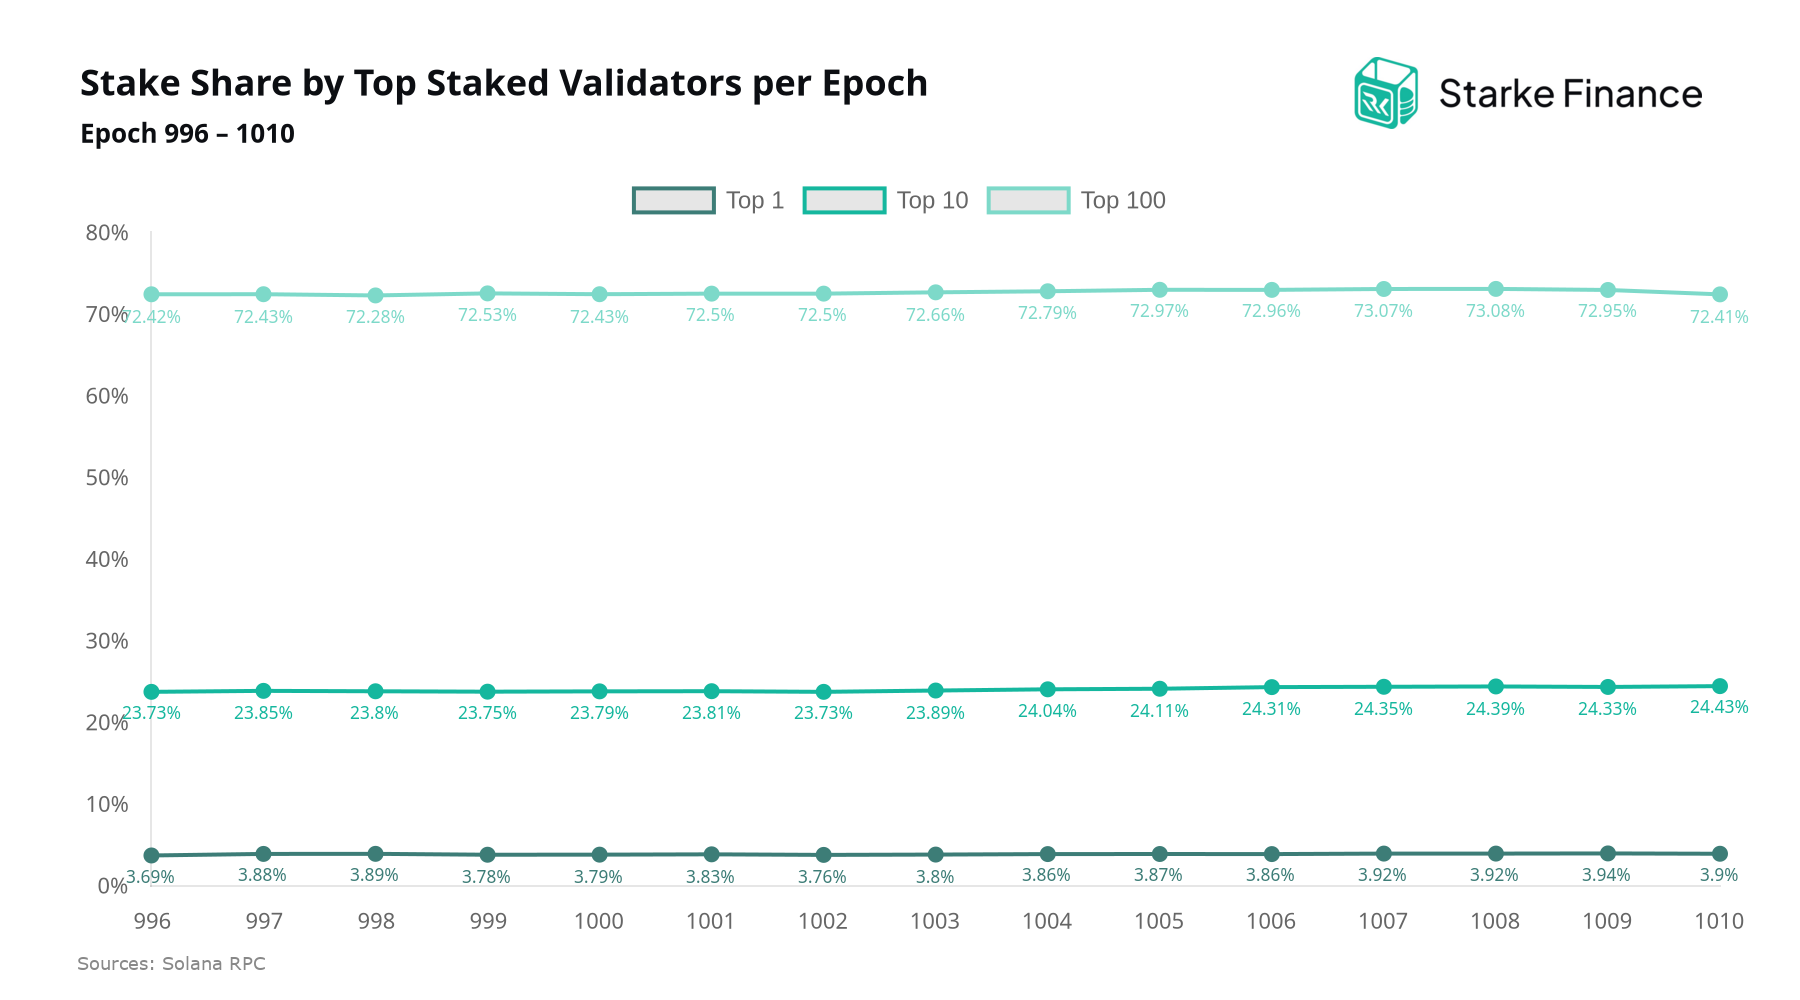
Across epochs 996–1010, stake concentration among the largest validators moved in mixed directions, a nuance worth noting for stakers monitoring decentralization risk. The top staked validator rose from 3.69% to 3.9%, and the top 10 collectively increased from 23.73% to 24.43%, while the top 100 edged marginally lower from 72.42% to 72.41%.
Validator Count by Epoch
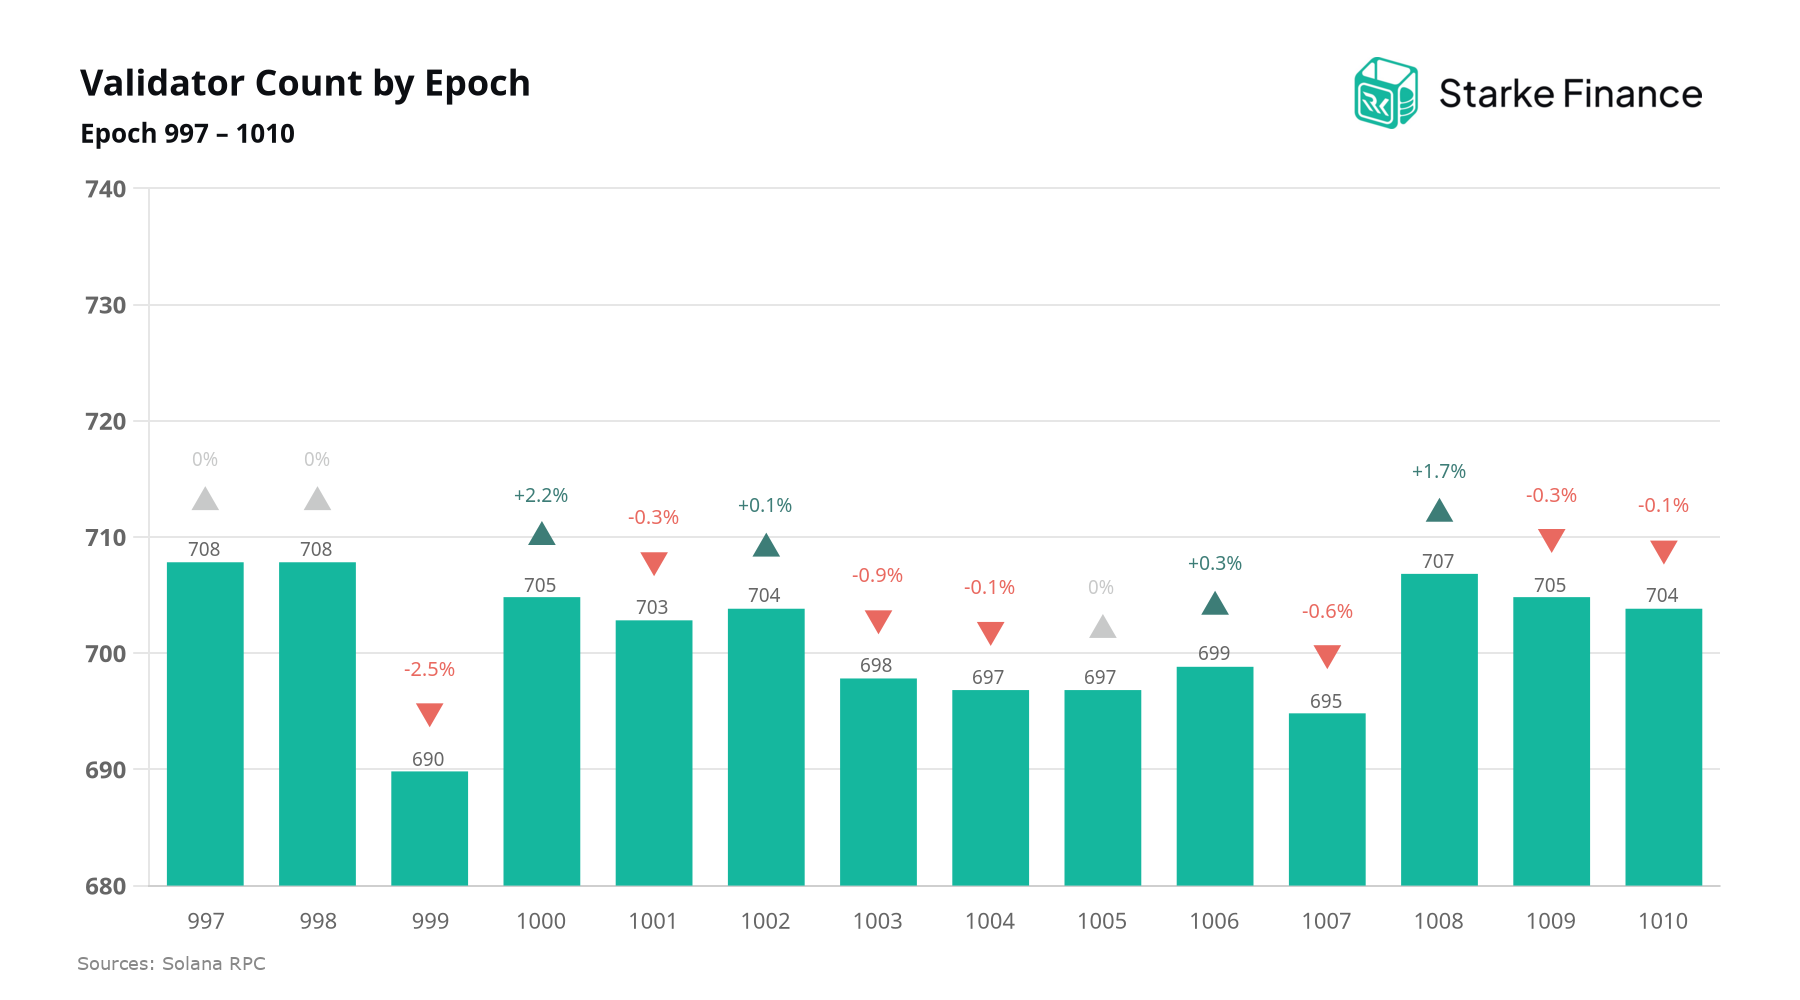
Across epochs 997–1010, the active validator set contracted marginally from 708 to 704, a net decline of 0.6%. The move was not linear: the steepest single-epoch drop occurred at epoch 999, down 2.5%, before the count partially recovered. For stakers assessing network resilience, small fluctuations of this magnitude are within normal operational range and do not materially alter Solana's decentralization profile, though the trajectory warrants continued monitoring.
Number of Validators Gaining, Losing and Stable Stake by Epoch
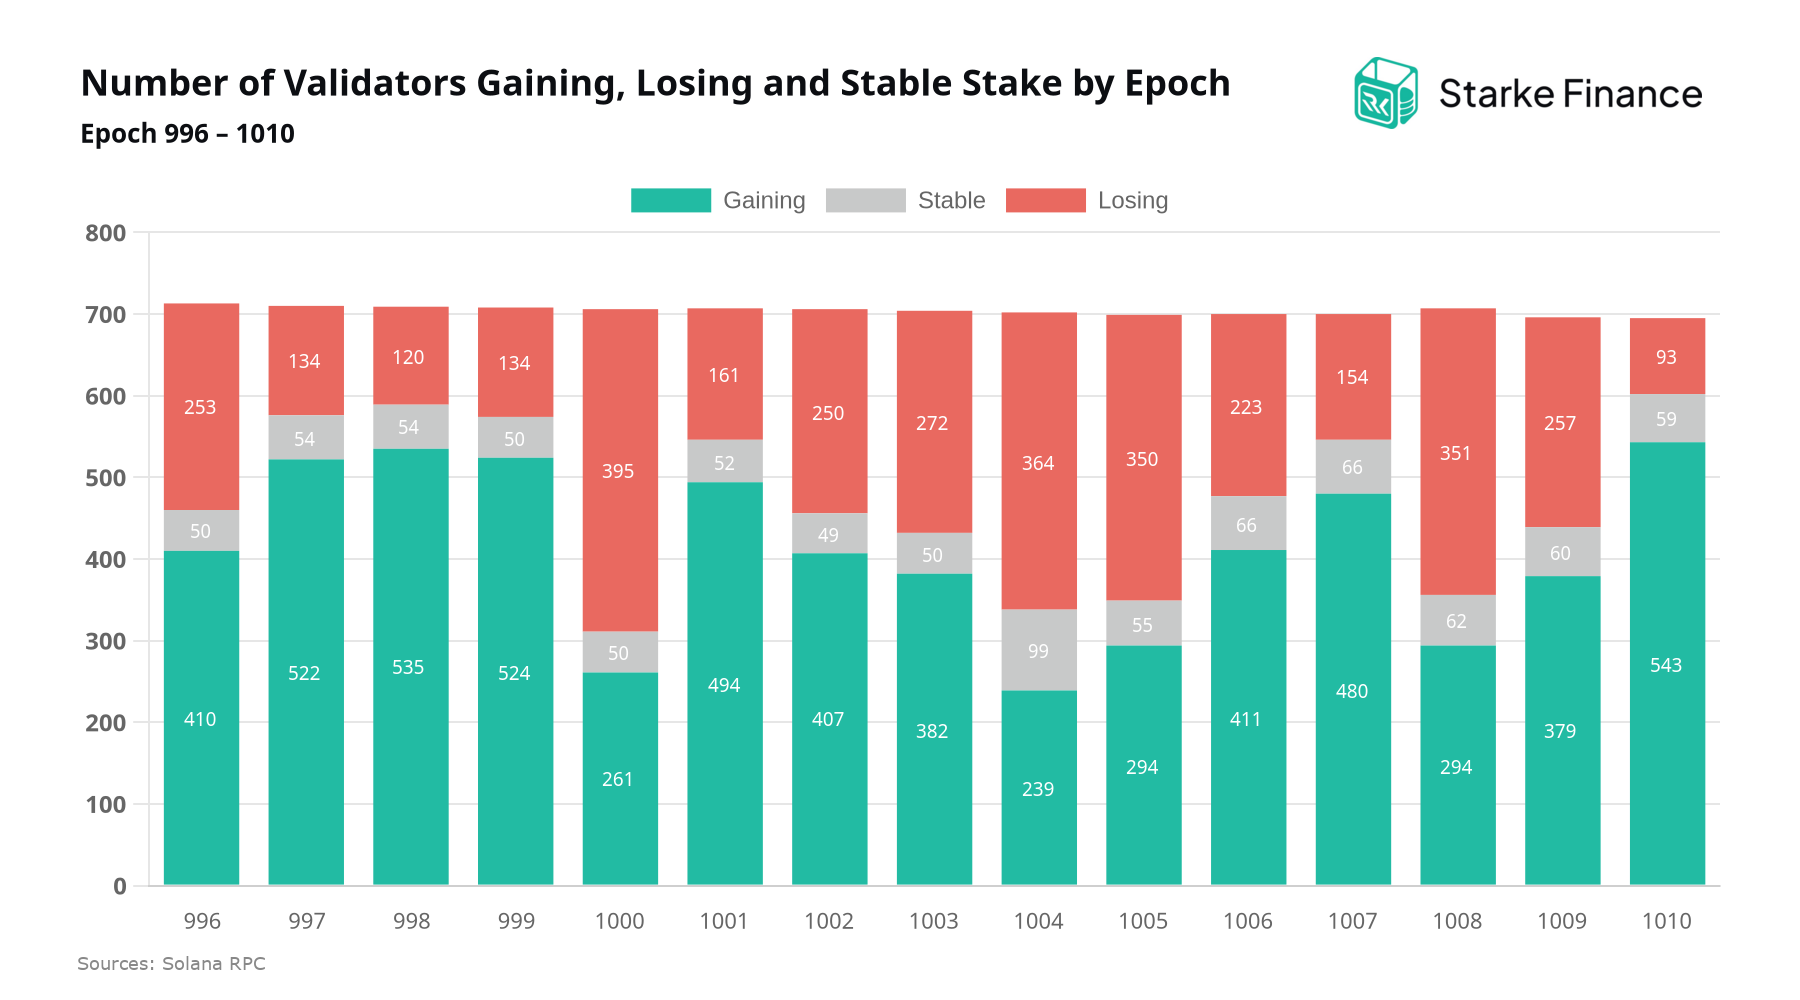
Across epochs 996–1010, total active stake rose by 5,660,125 SOL, with an average of 58.46% of validators gaining stake, 33.24% seeing net outflows, and 8.29% remaining stable. The breadth of participating validators, rather than concentration among a few large operators, is a constructive signal for decentralization and suggests delegators are distributing flows across a wide operator set, a dynamic worth monitoring for stakers assessing validator selection and network resilience.
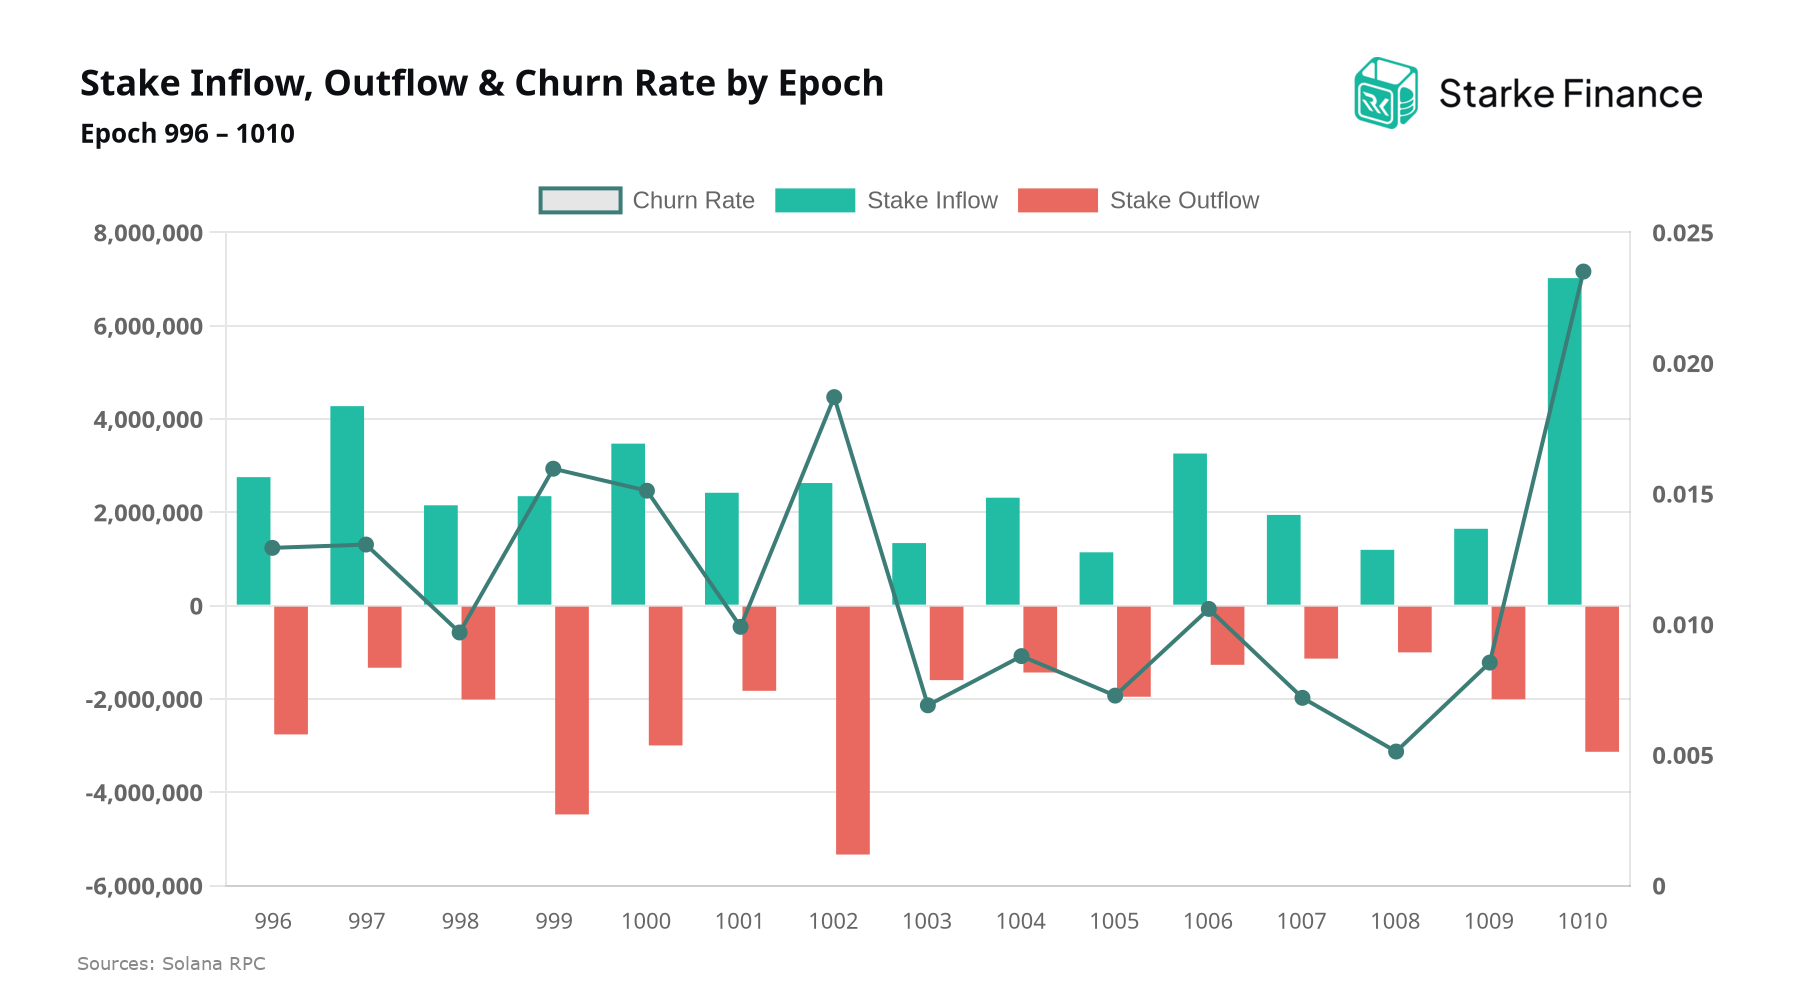
Stake Inflow, Outflow & Churn Rate by Epoch
Stake flow dynamics offer a useful lens on delegator engagement and validator competition. Epoch 1010 saw the strongest inflow at 7.0M SOL, while epoch 1002 recorded the largest outflow at -5.3M SOL. Churn rate, the stake movement relative to total network stake, ranged from 0.51% to 2.35%, increasing over the period and indicating growing stake mobility. On average, 1.16% of total network stake moved per epoch, corresponding to 74.2M SOL of cumulative flow.
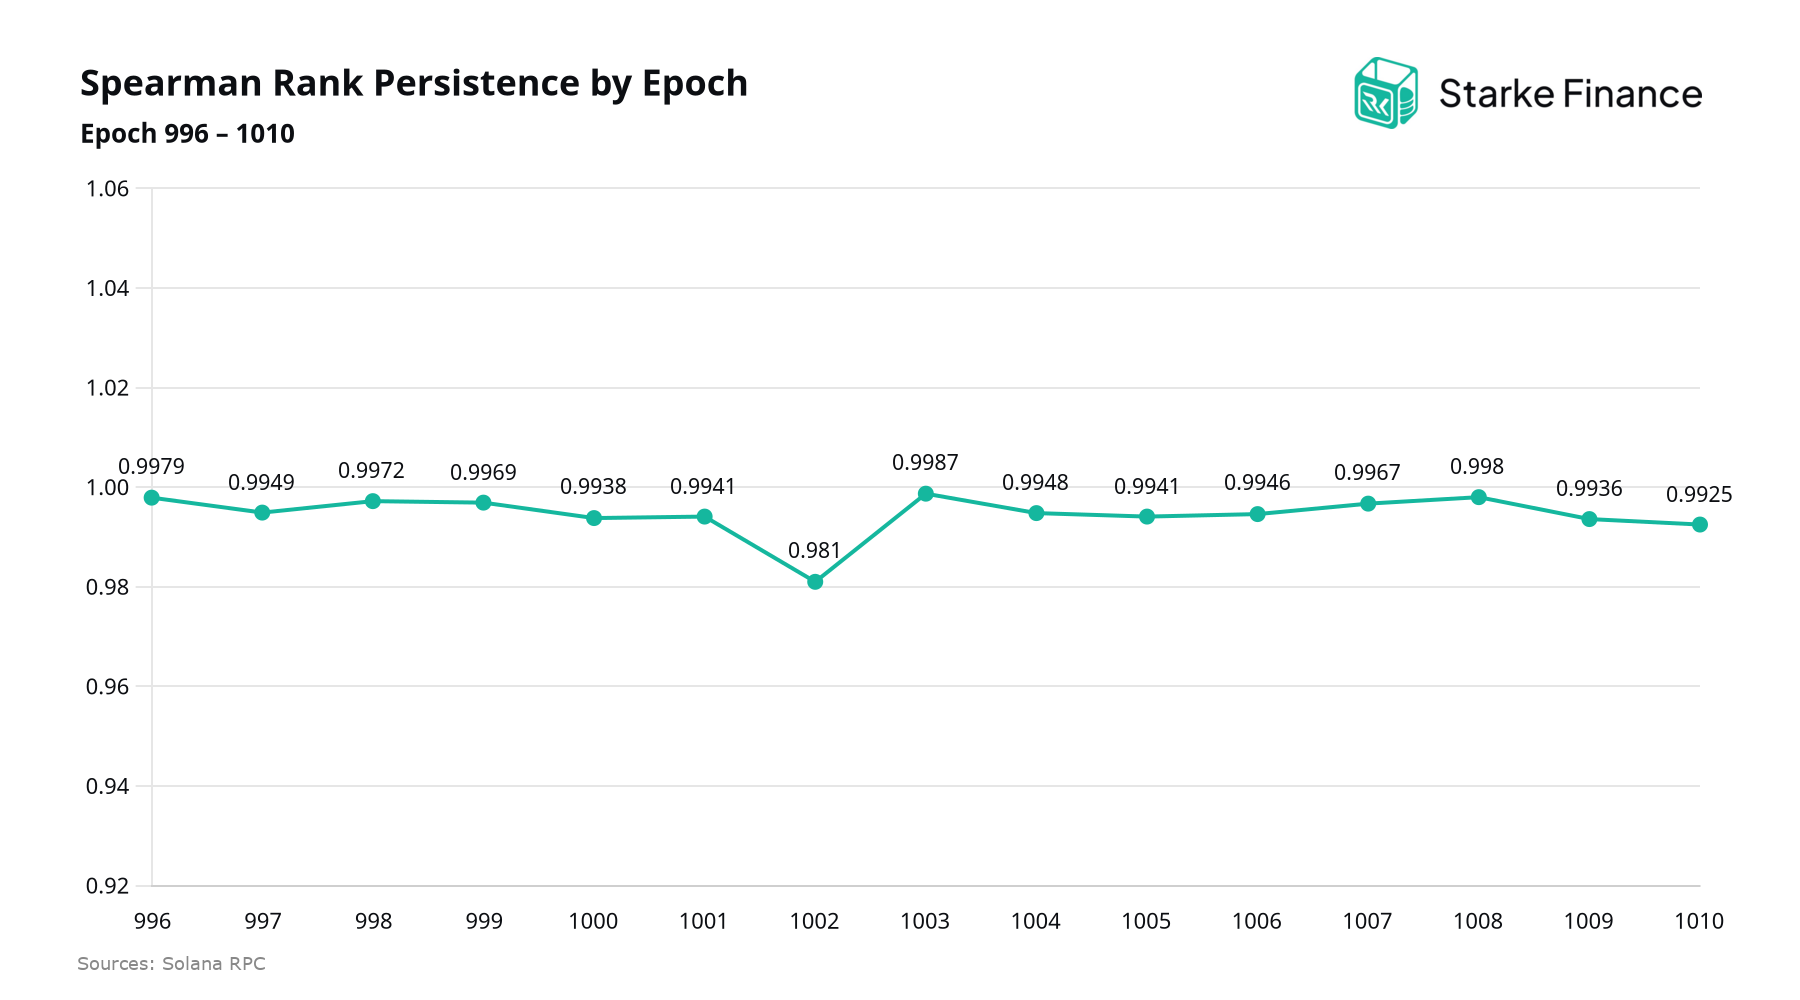
Spearman Rank Persistence by Epoch
Spearman Rank Persistence measures how stable the validator ranking by stake is from one epoch to the next, with values closer to 1 indicating minimal reordering. Across epochs 996–1010, readings ranged from 0.9810 to 0.9987, pointing to a highly stable validator set in which most operators retained similar relative positions.
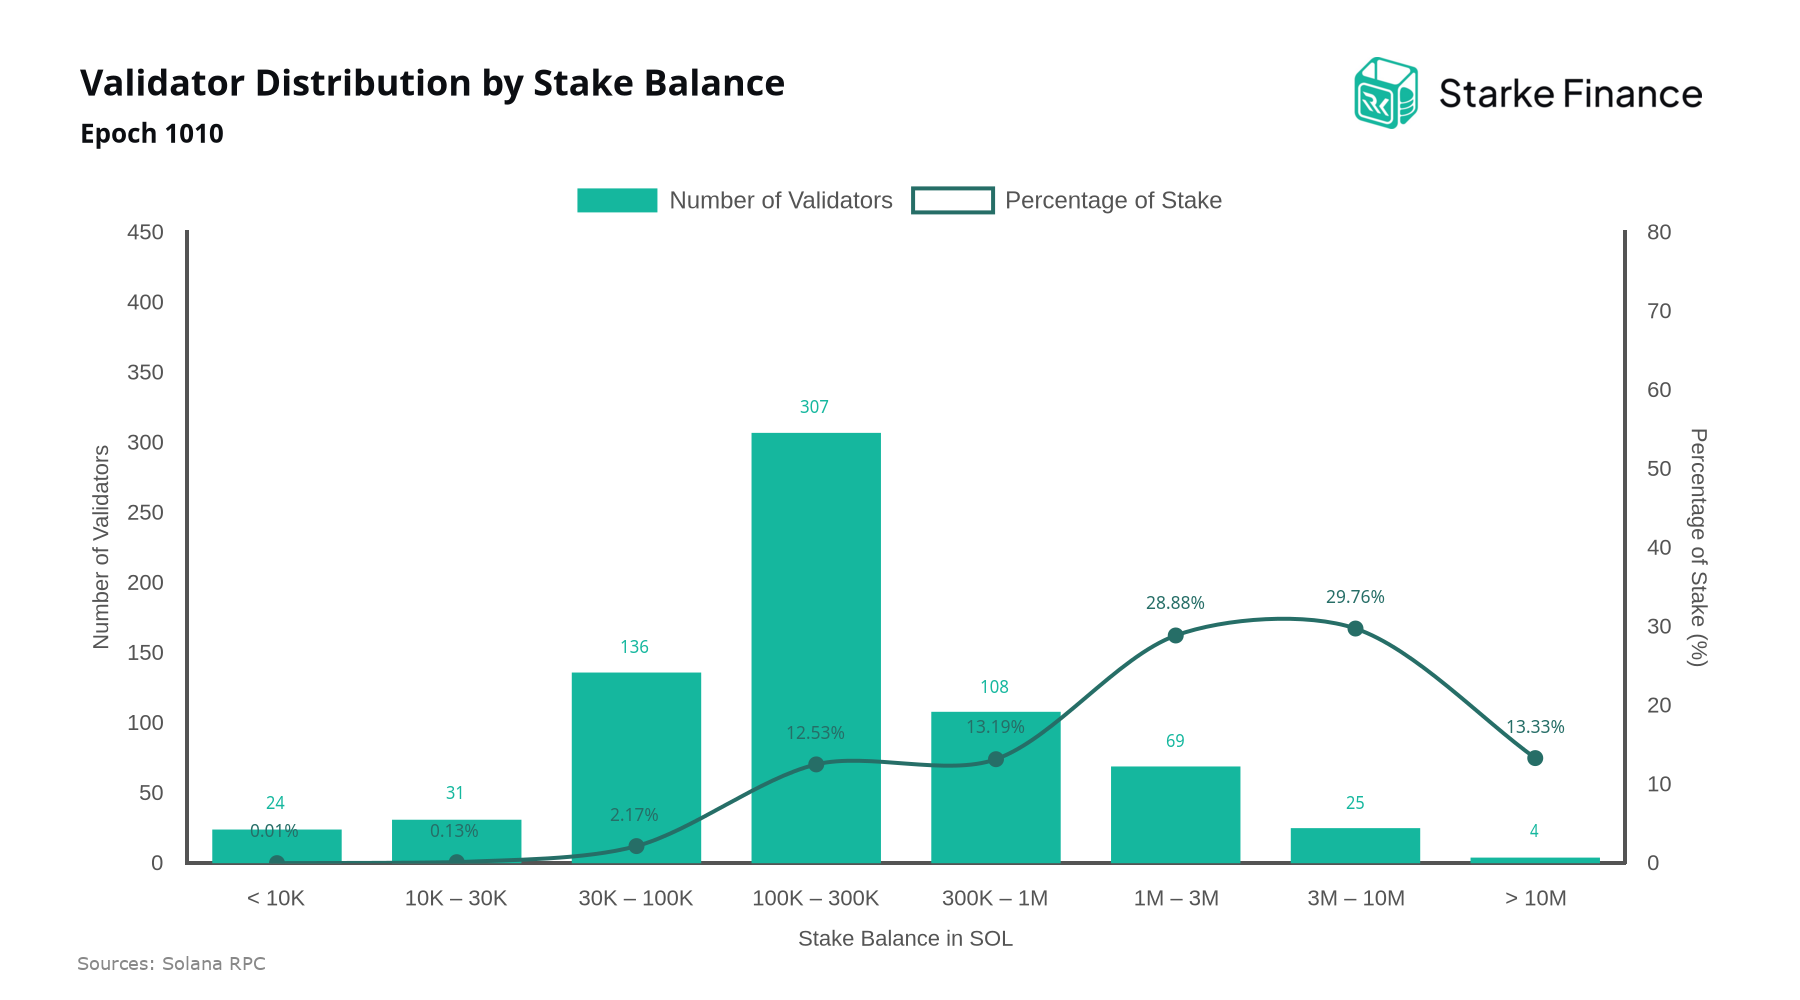
Validator Distribution by Stake Balance
As of epoch 1010, stake distribution remains concentrated in the upper-mid tiers: the 3M–10M SOL range leads at 29.76% across just 25 validators, followed closely by the 1M–3M SOL range at 28.88% across 69 validators. Median validator stake rose from ~166,749 to ~170,600 SOL between epochs 996 and 1010, indicating the typical validator continues to grow in size.
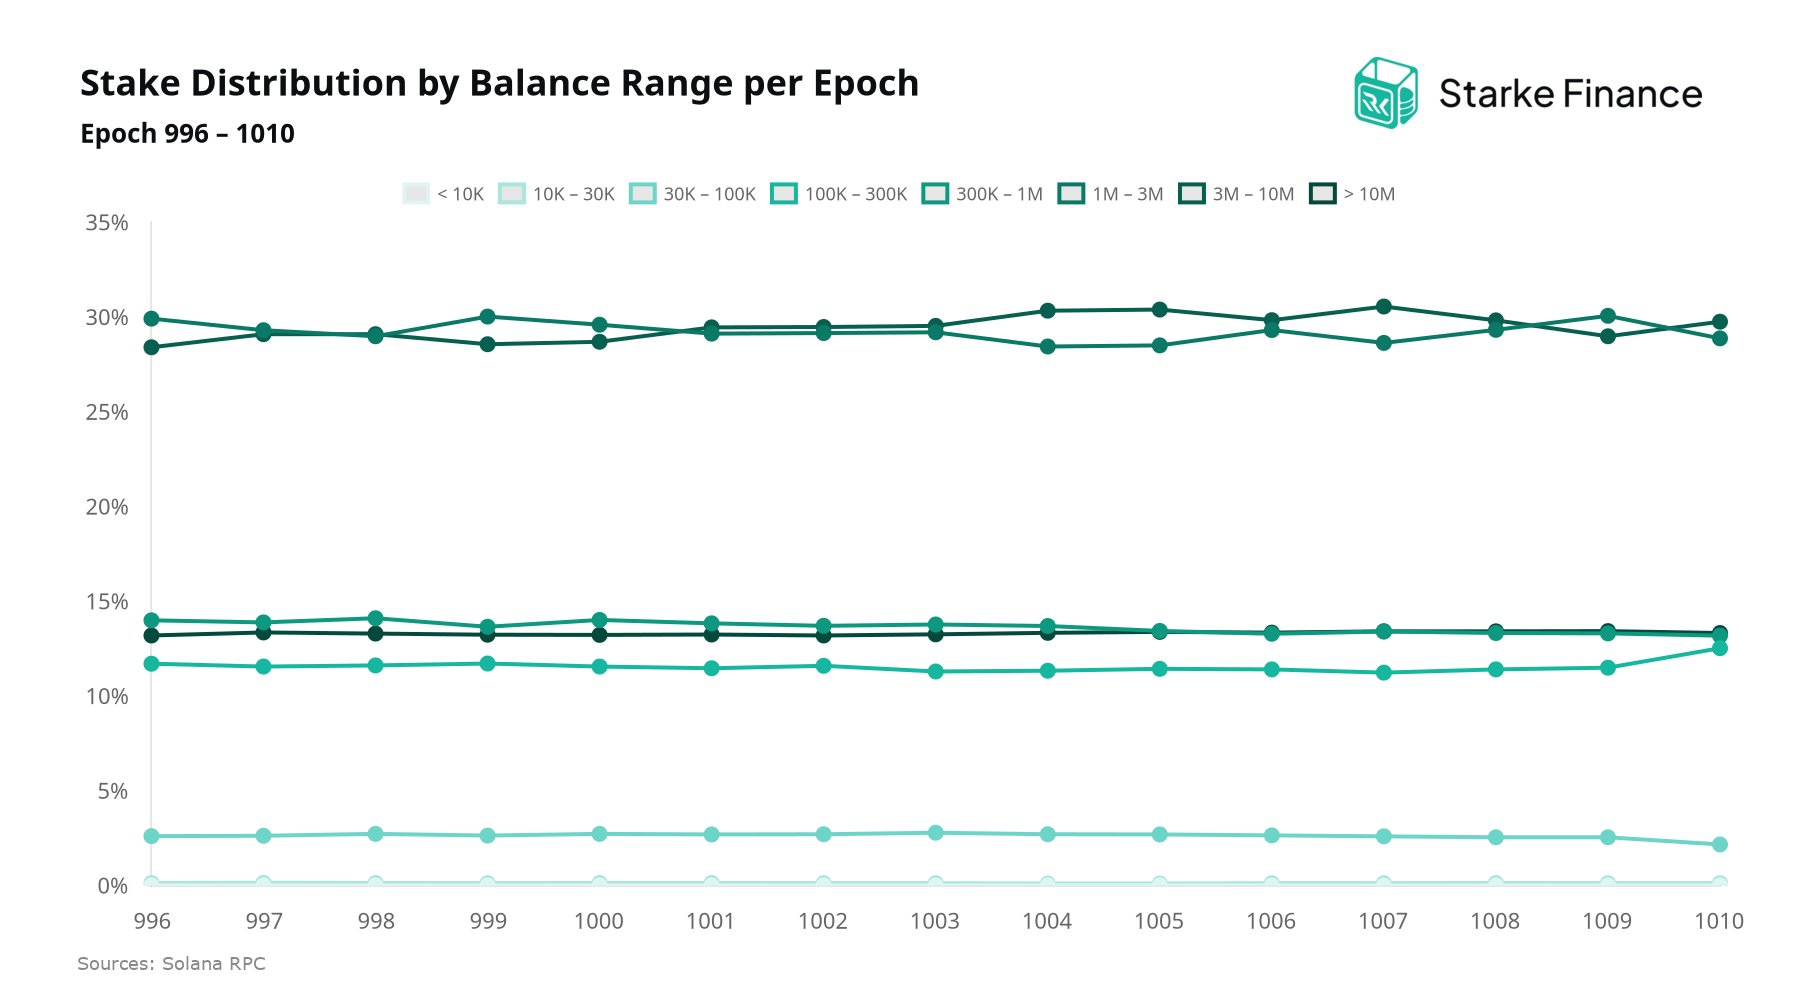
Validator Distribution by Stake Balance by Epoch
Between epochs 996 and 1010, validators in the 3M – 10M SOL range posted the largest gain in stake share, moving from 28.41% to 29.76%, while validators in the 1M – 3M SOL range recorded the steepest decline, easing from 29.92% to 28.88%. The shift is modest but points to a gradual consolidation of stake toward larger operators, a dynamic worth monitoring by delegators and allocators focused on validator decentralization and the long-term distribution of consensus weight across the network.
Solana Validator Client Distribution
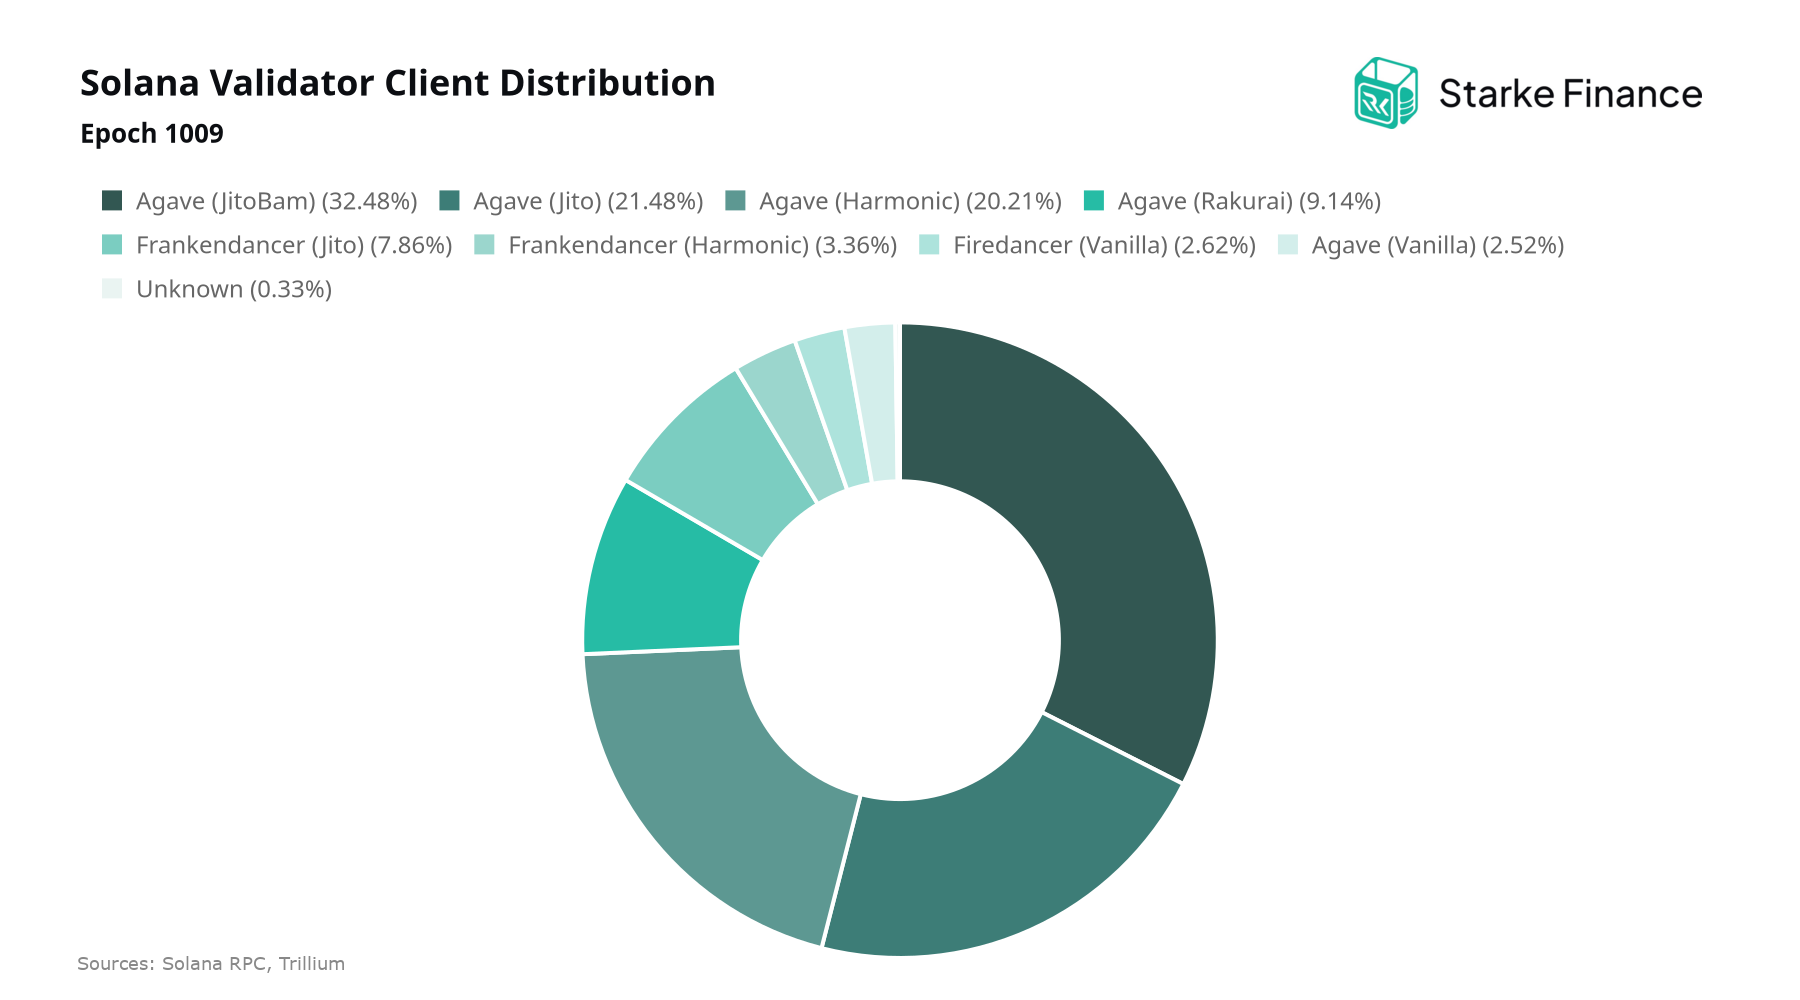
As of Epoch 1009, Agave dominates the network with 368M SOL (86.1%) across 628 validators, followed by Frankendancer at 48M SOL (11.3%) across 58 validators and Firedancer at 11M SOL (2.6%) across 5 validators. Broken down by client-scheduler combination, Agave (JitoBAM) accounts for 139M SOL (33%) across 380 validators, while Agave (Jito) represents 92M SOL (22%) across 142 validators.
Solana Client Stake Distribution
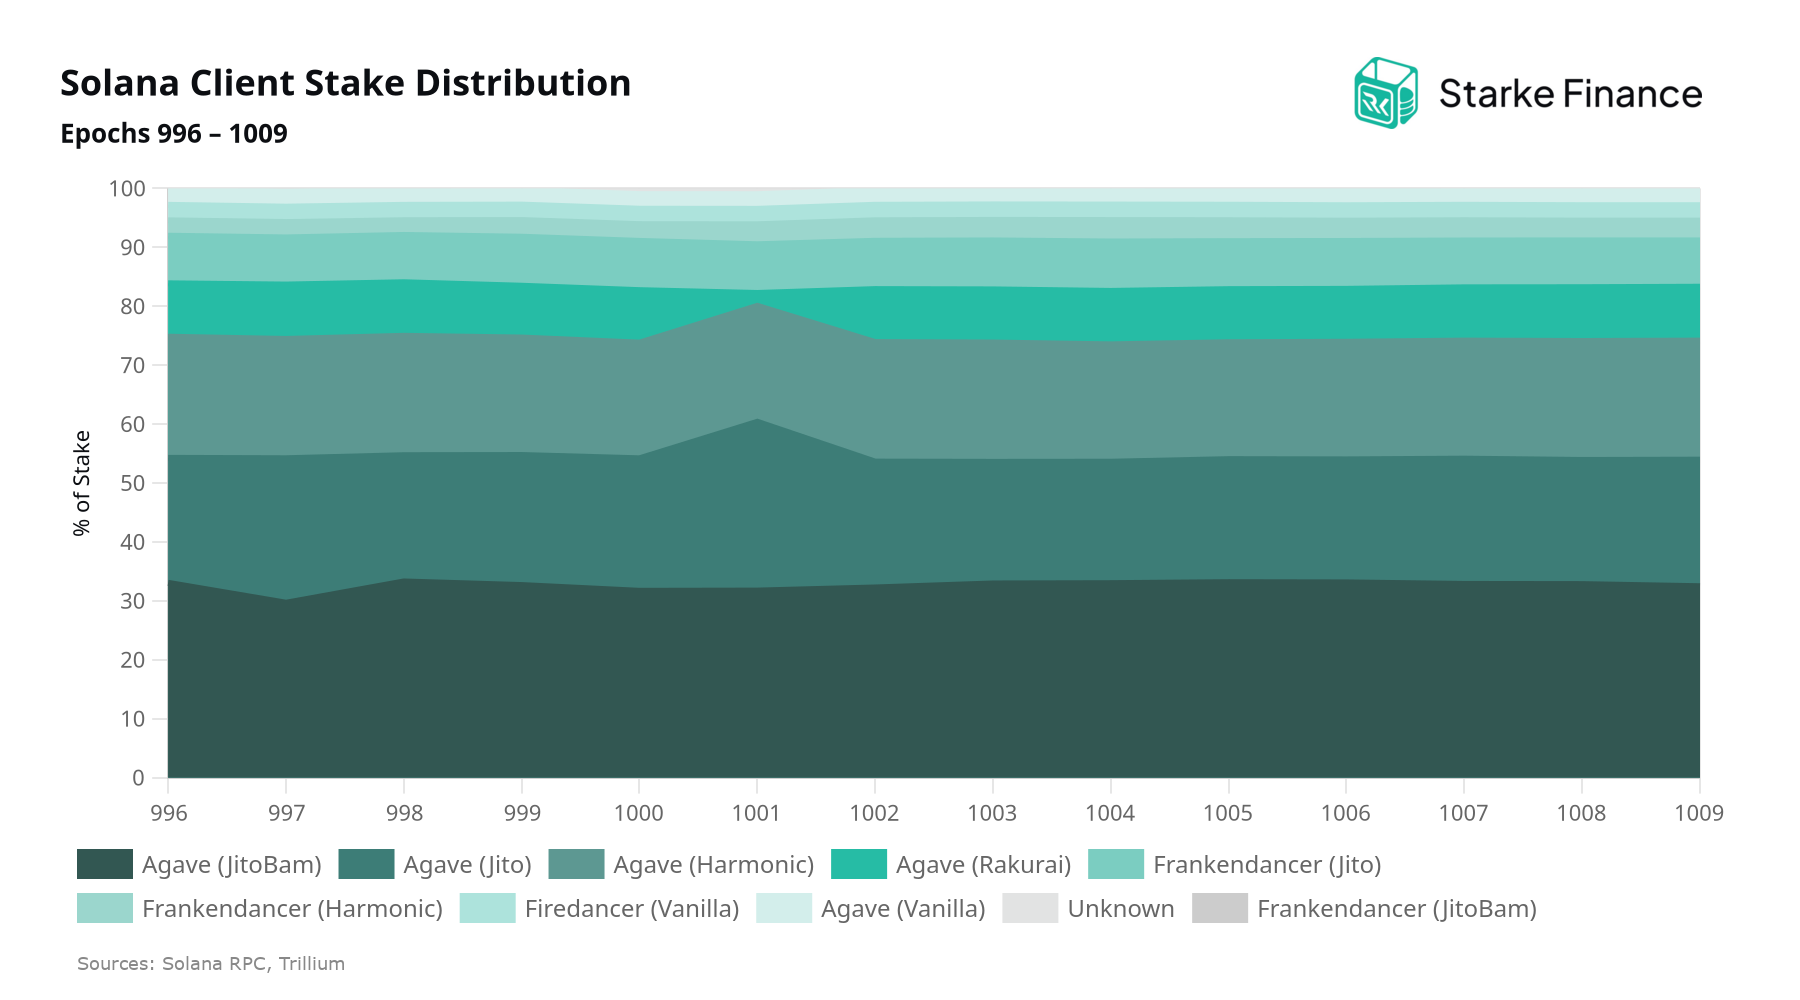
Client diversity remains a key indicator of Solana's resilience, and the latest epoch window shows measured but meaningful movement. Agave's share slipped from 86.7% at epoch 996 to 86.1% at epoch 1009, with validator count falling from 638 to 628 and stake down 0.3%. Frankendancer picked up the slack, rising from 10.7% to 11.3% as validators grew from 56 to 58 and stake advanced 5.5%. Firedancer held flat at 2.6%, with validators easing from 6 to 5 even as stake edged up 0.1%.
SOL Supply Distribution by Epoch
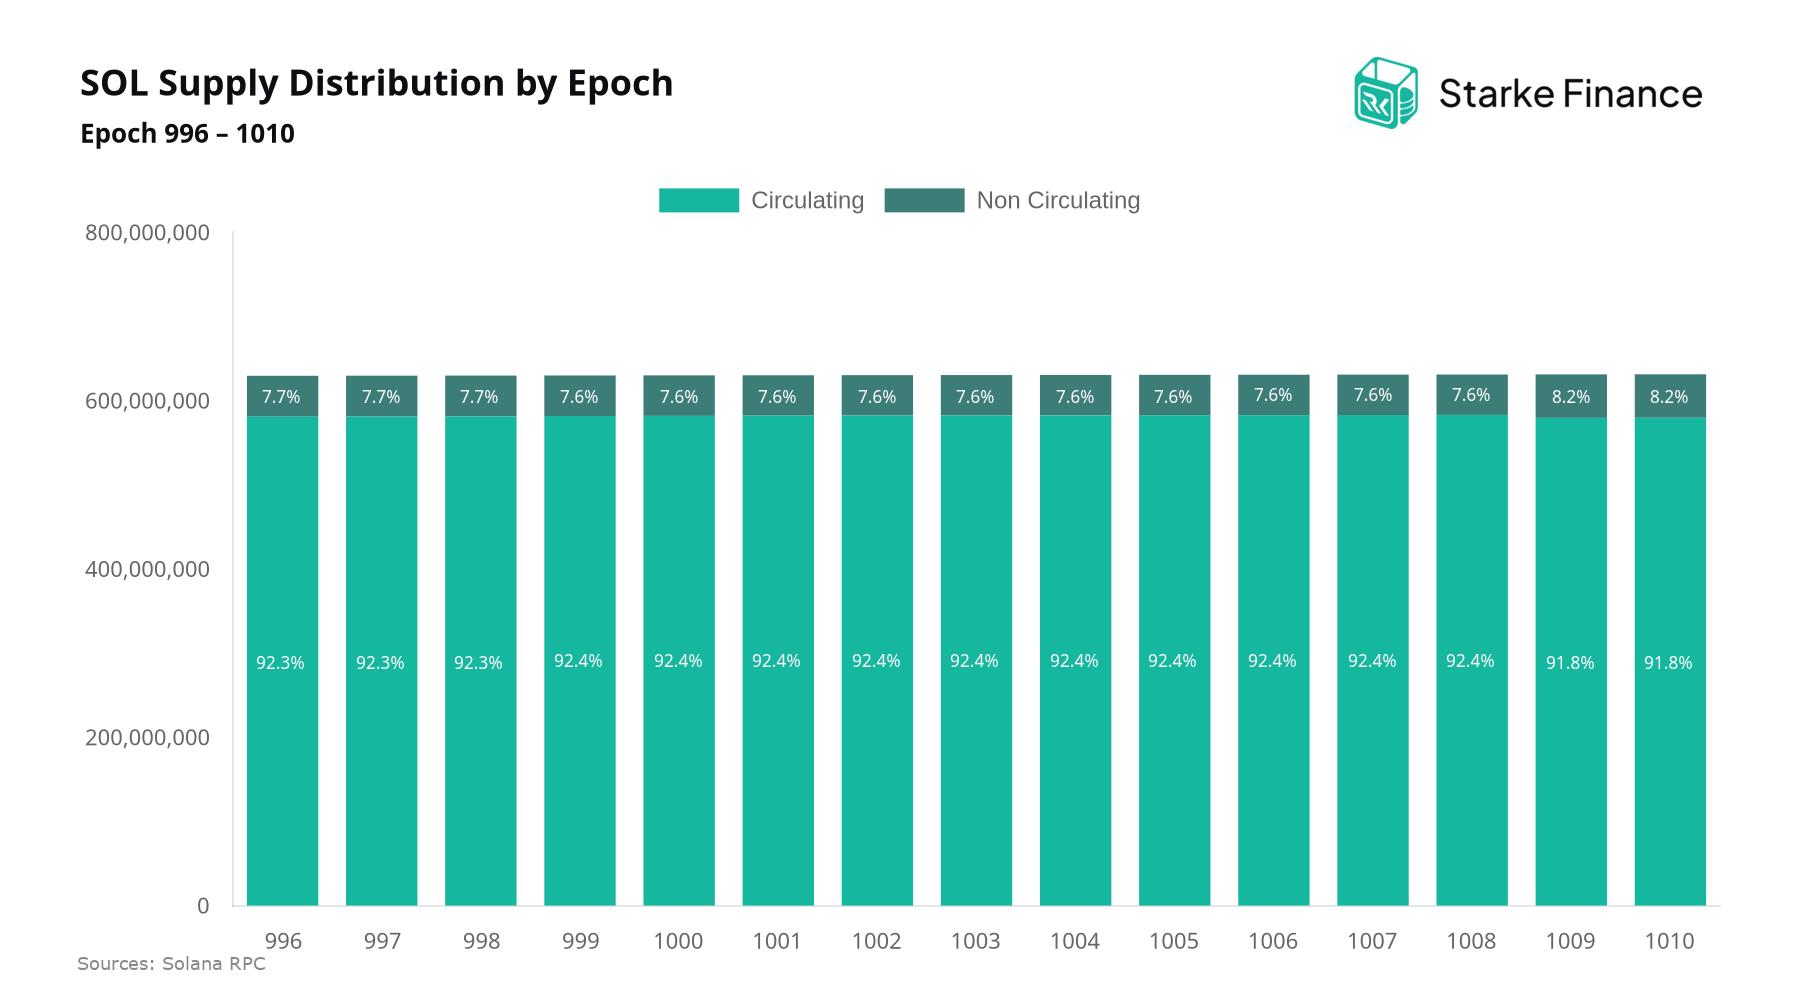
Across epochs 996–1010, circulating supply contracted by 1,311,801 SOL while non-circulating supply expanded by 3,097,652 SOL, producing a net increase of 1,785,851 SOL in total supply. As of epoch 1010, total supply stands at 631,376,994 SOL, split between circulating supply at 91.8% (579,703,460 SOL) and non-circulating supply at 8.2% (51,673,534 SOL).
SOL Staking Ratio
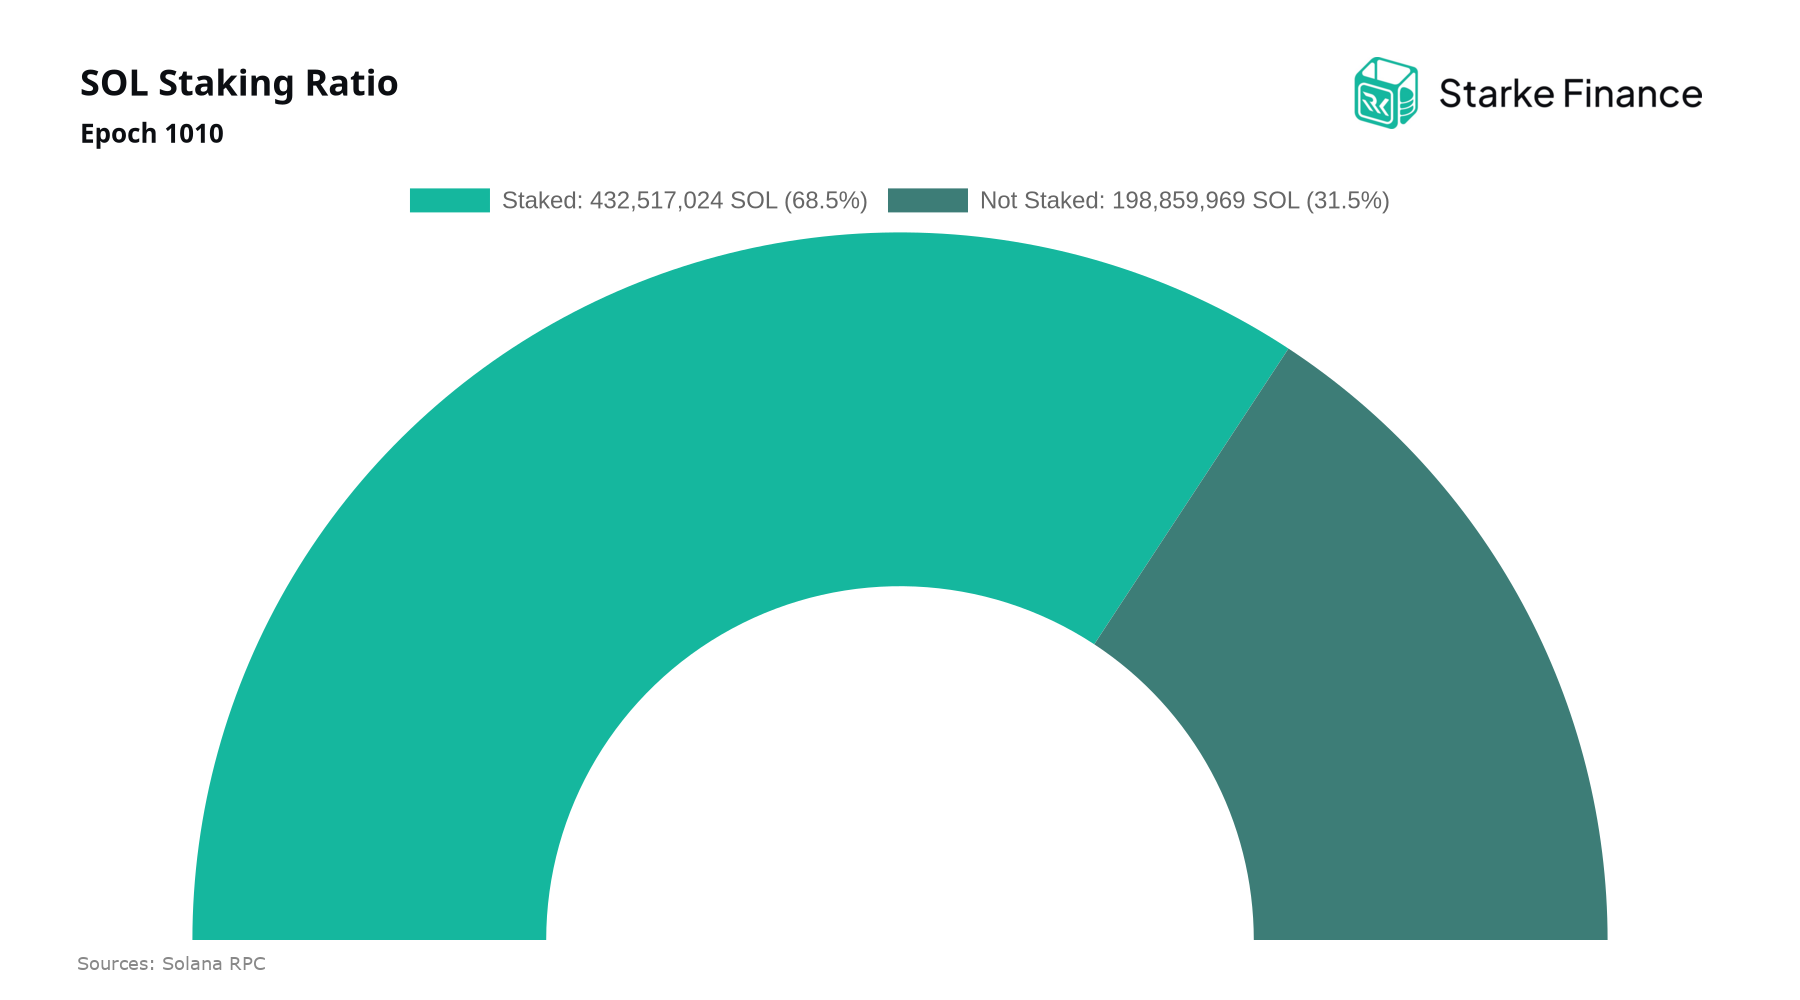
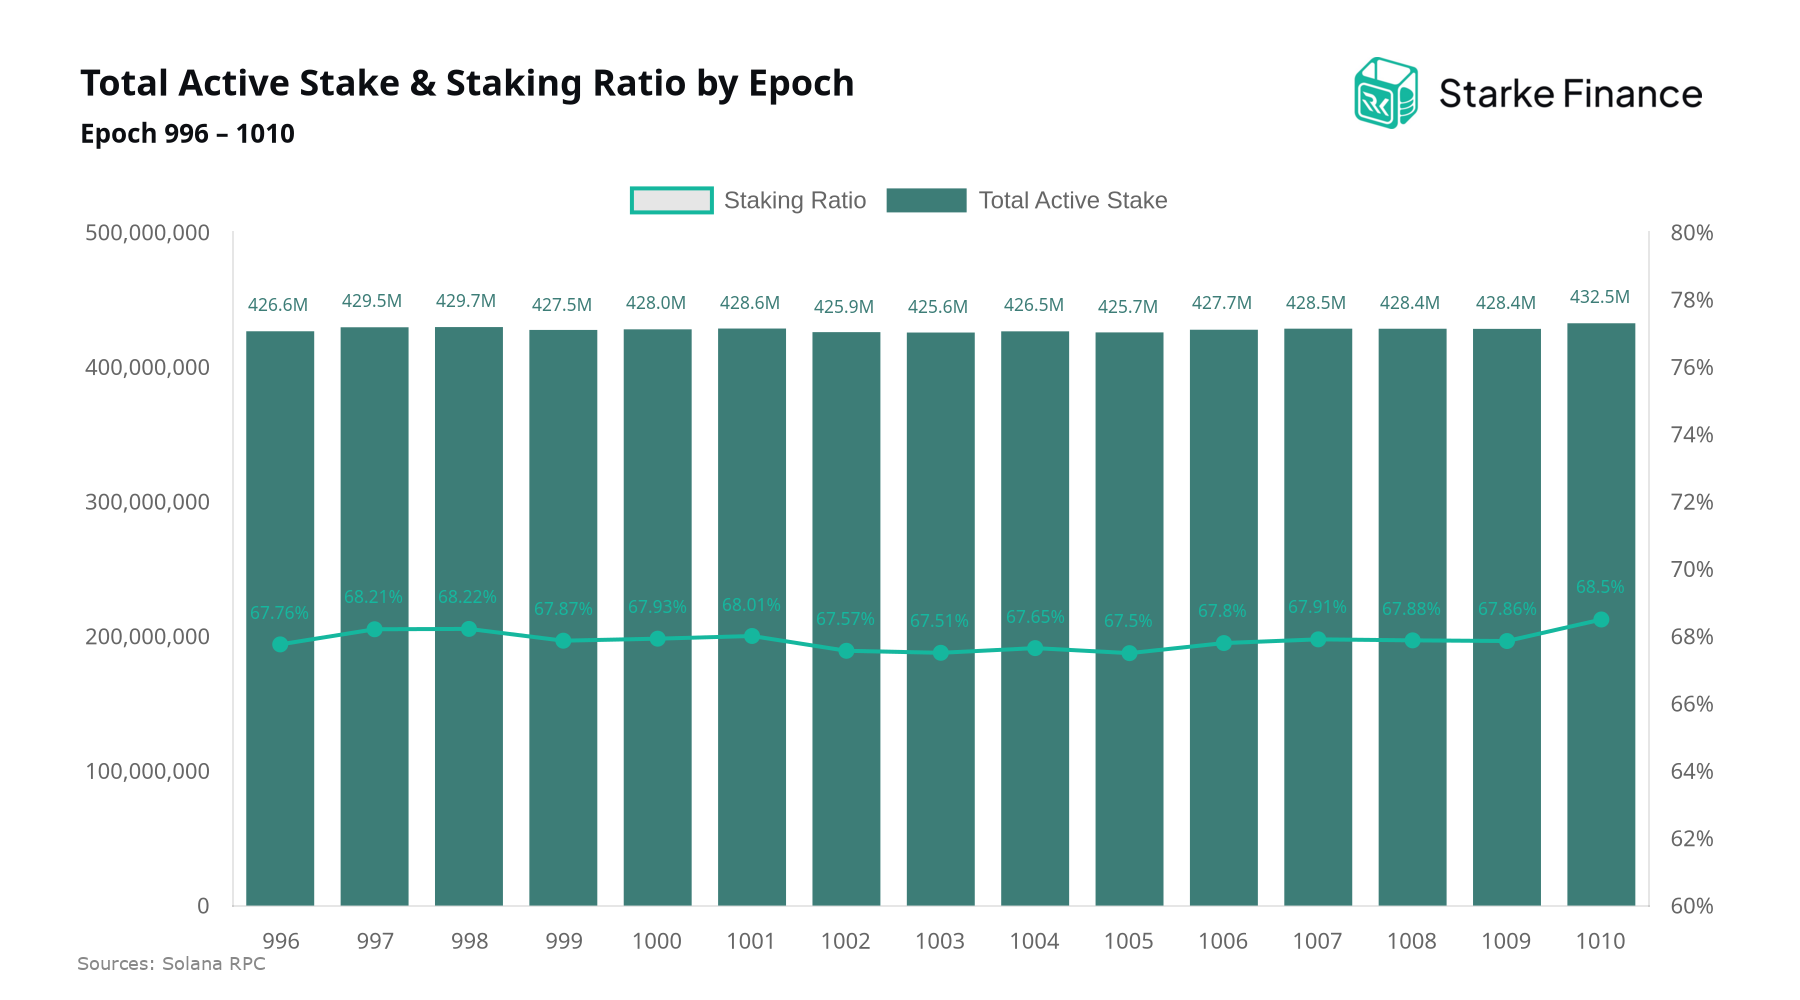
As of epoch 1010, 432,517,024 SOL is actively staked, representing 68.5% of total supply. This staking ratio remains among the highest of any major proof-of-stake network, reflecting sustained validator participation and a strong economic security base underpinning the chain.
Total Active Stake & Staking Ratio by Epoch
Total active stake grew from 426,582,882 to 432,517,024 SOL between epochs 996 and 1010, an increase of 5,934,142 SOL, while the staking ratio rose from 67.8% to 68.5% over the same period. A rising share of circulating supply committed to validators strengthens the network's economic security and signals continued holder conviction, both relevant considerations for allocators assessing Solana's baseline stability and the durability of staking yields.
Top 10 Stake Movements Between Cities
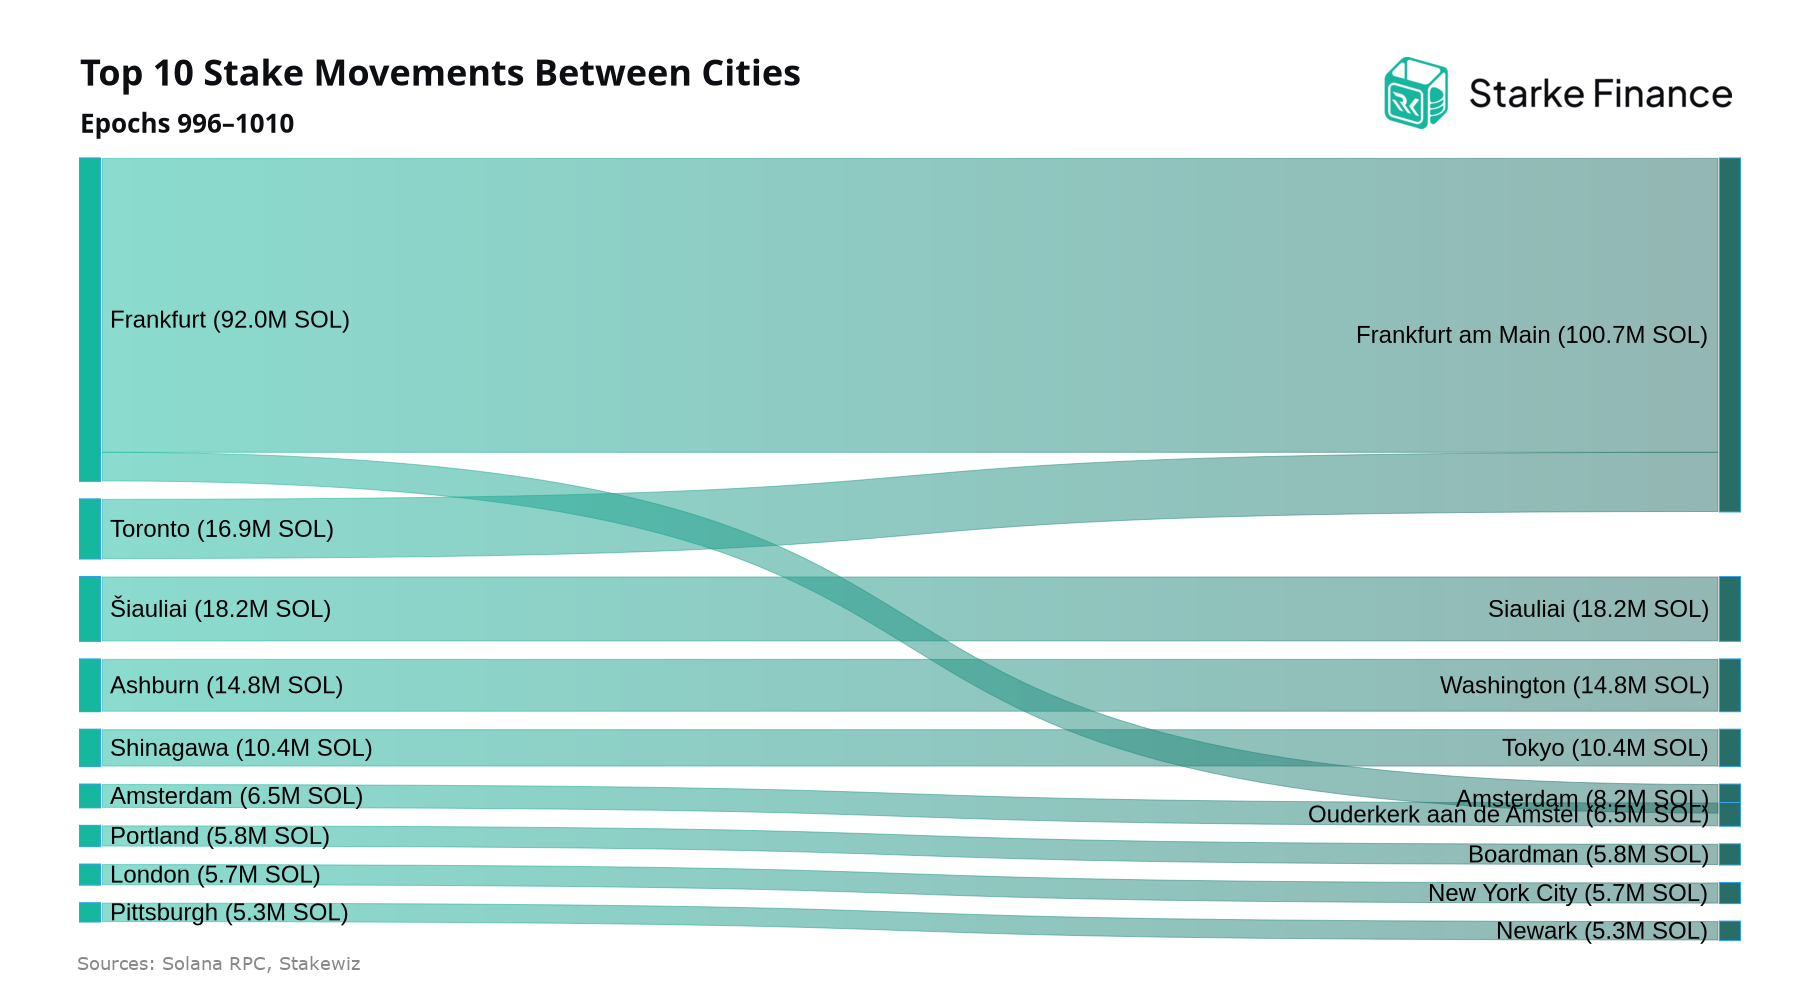
Over the last 15 epochs, the largest stake movement between cities was 83.8M SOL from Frankfurt to Frankfurt am Main across 110 validators, followed by 18.2M SOL from Šiauliai to Siauliai across 14 validators. Both flows reflect geolocation relabelling of the same physical infrastructure rather than genuine validator migration, and should be read as a data-hygiene artifact when assessing geographic decentralization trends rather than as a shift in the underlying network footprint.
Top 10 Cities by Stake
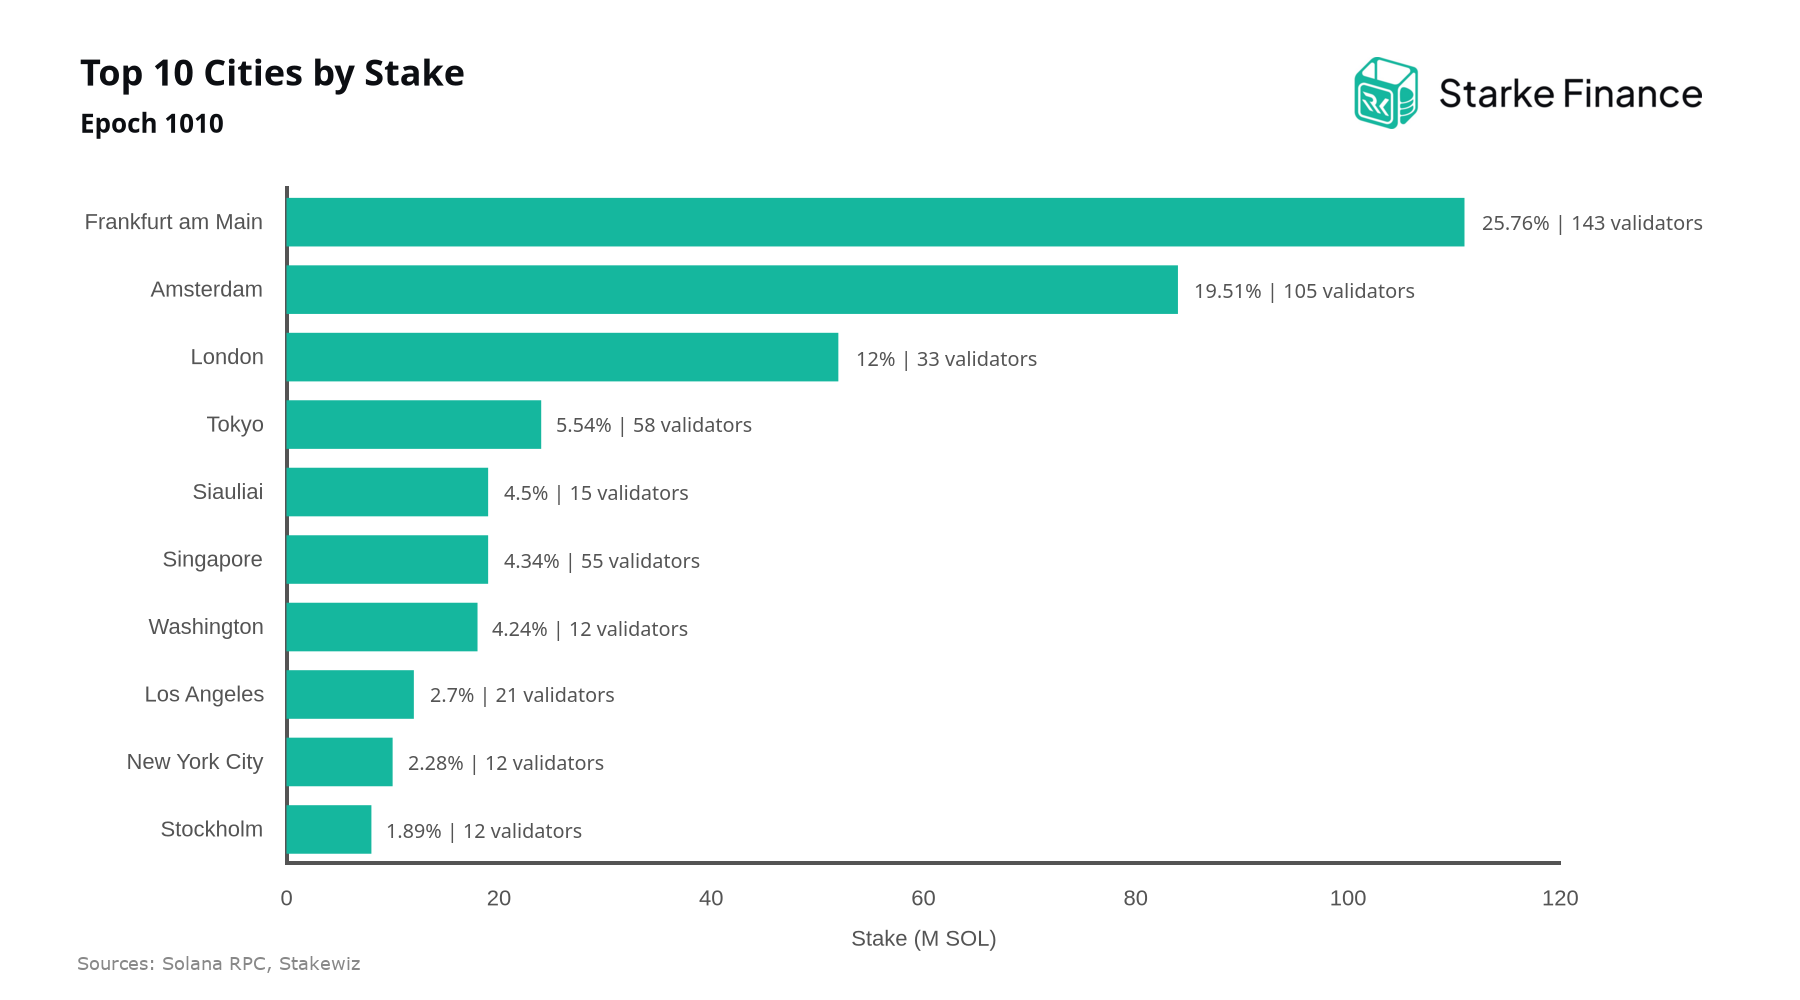
Geographic distribution of stake at the city level remains an important lens on Solana's physical decentralization, since concentration in a small number of metros can amplify jurisdictional and infrastructure risk for delegators. Over the last 15 epochs, city-level concentration stayed in a low range but drifted higher, with the HHI rising from 1100 to 1306. Frankfurt am Main recorded the largest increase at +72,117.3%, while Dubai saw the sharpest decline at -98.4%.
Top 10 Stake Movements Between Countries
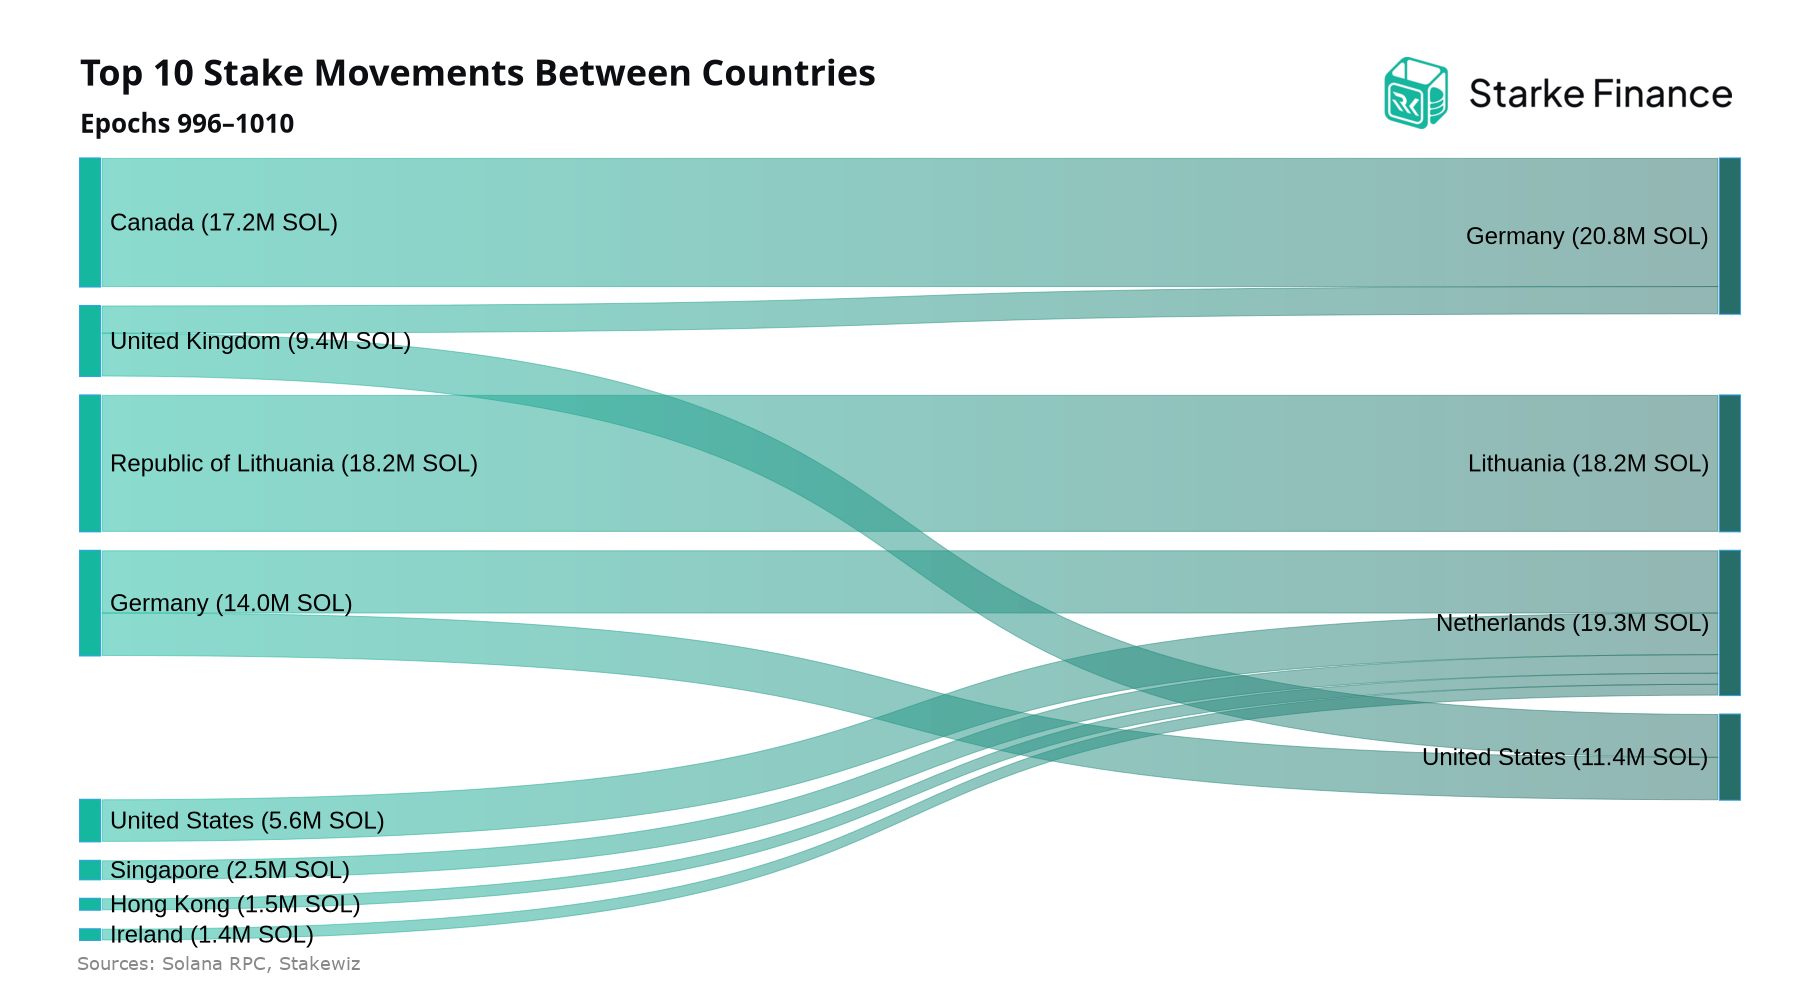
Cross-border stake flows offer a useful lens on how geographic concentration evolves at the validator layer. Over the last 15 epochs, the largest movement between countries was 18.2M SOL from Republic of Lithuania to Lithuania across 14 validators, followed by 17.2M SOL from Canada to Germany across 2 validators.
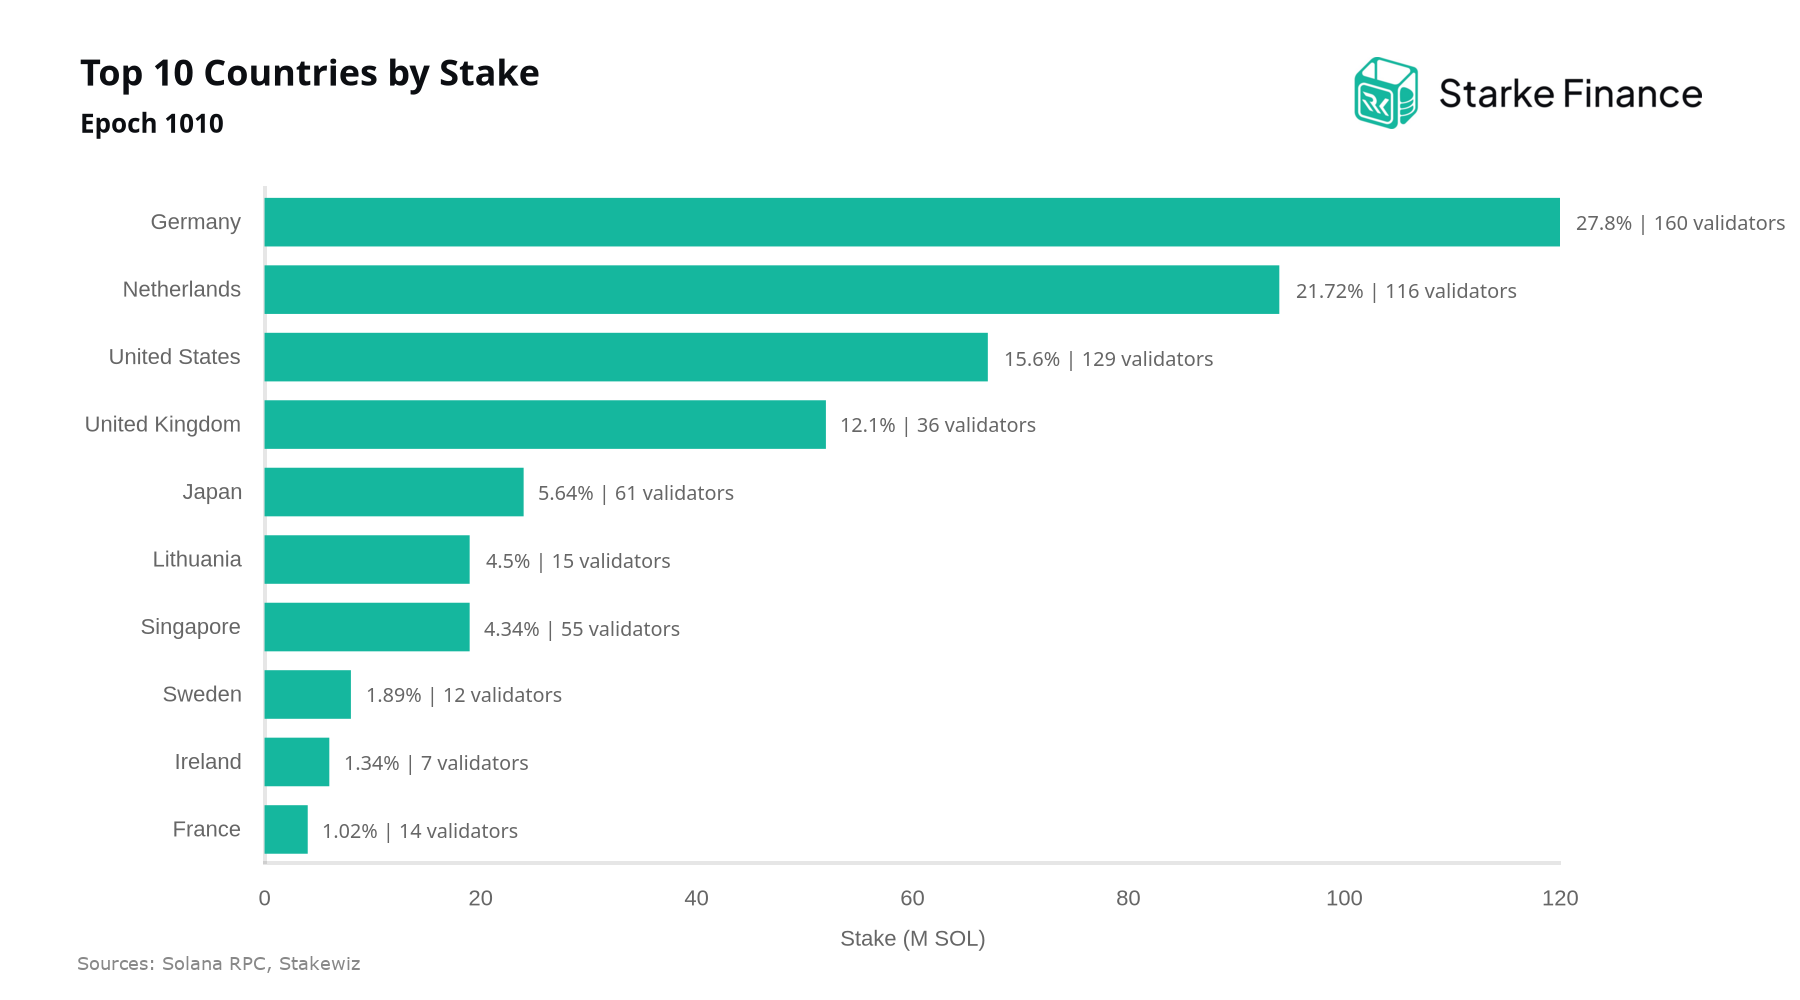
Top 10 Countries by Stake
Geographic distribution of stake shifted modestly over the last 15 epochs, with the country-level HHI rising from 1,509 to 1,713 — still within a moderate concentration band, but trending upward. Spain led inflows at +124.1%, while the United Arab Emirates saw stake fall -98.4%. Germany and the Netherlands remain the largest jurisdictions at 120.2M and 93.9M SOL, gaining 9.3% and 21.0% respectively.
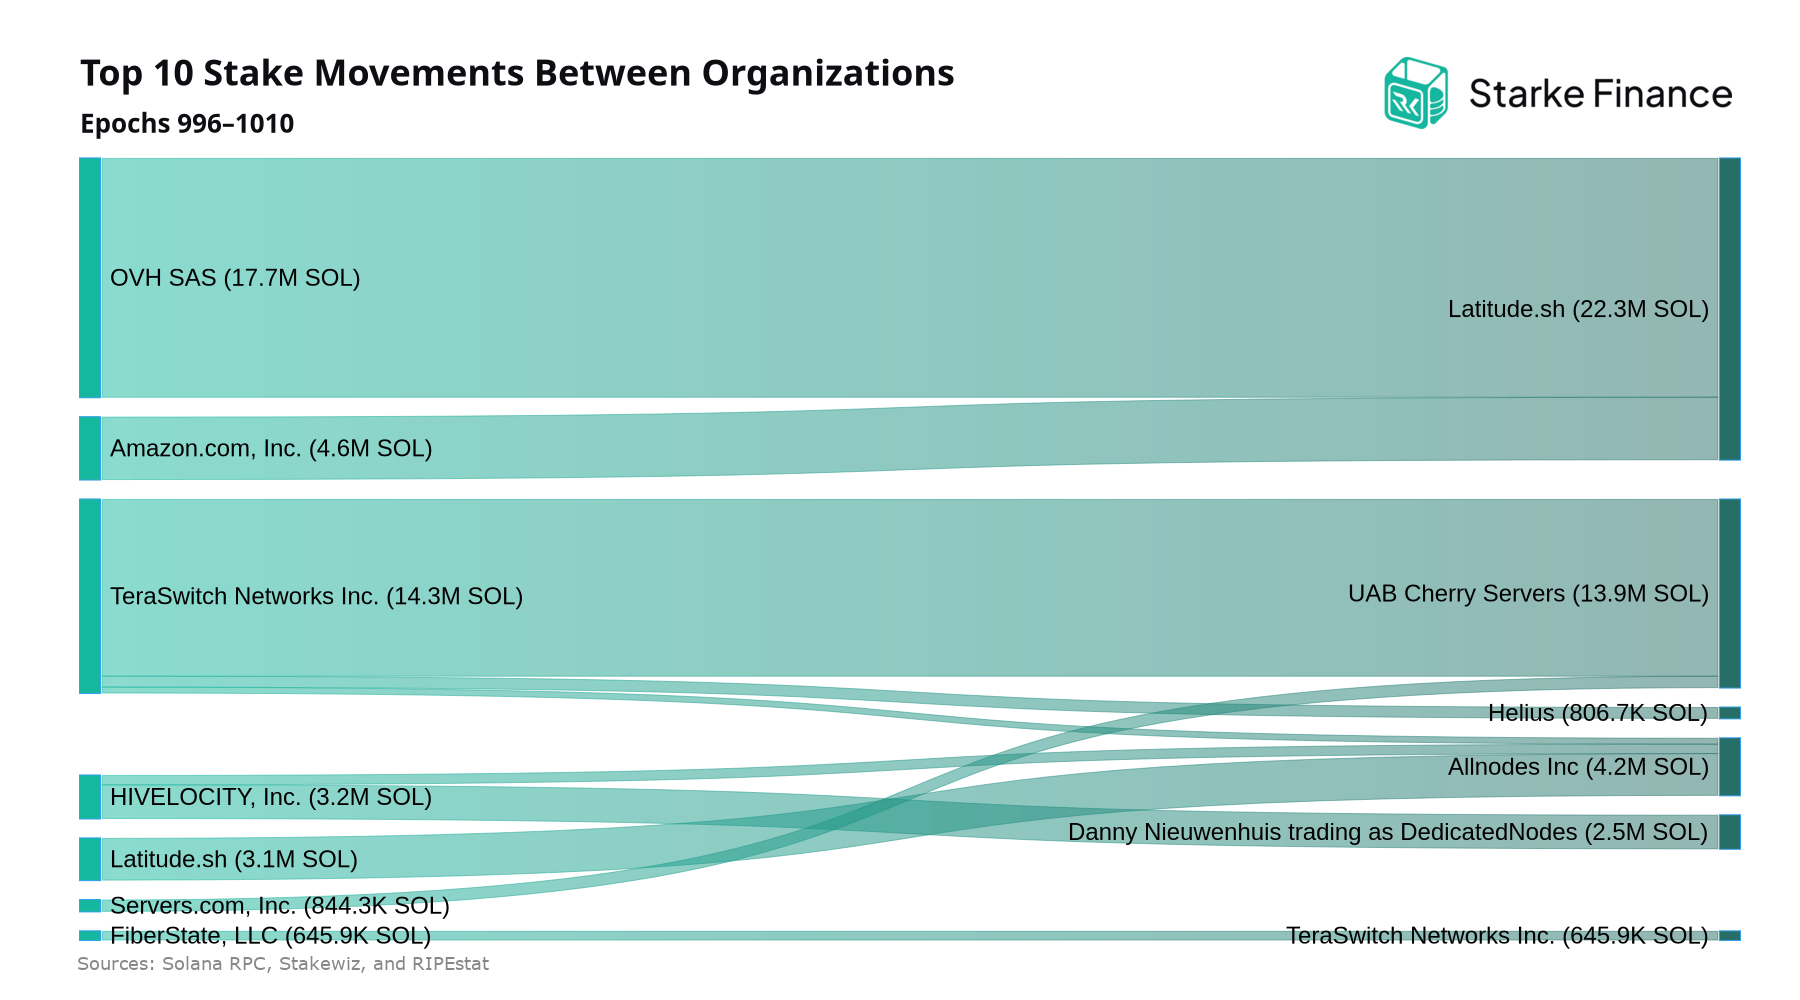
Top 10 Stake Movements Between Organizations
Tracking stake migration between hosting organizations offers a useful lens on operational concentration risk at the infrastructure layer. Over the last 15 epochs, the largest stake movement between organizations was 17.7M SOL from OVH SAS to Latitude.sh across 3 validators, followed by 13.1M SOL from TeraSwitch Networks Inc. to UAB Cherry Servers across 2 validators.
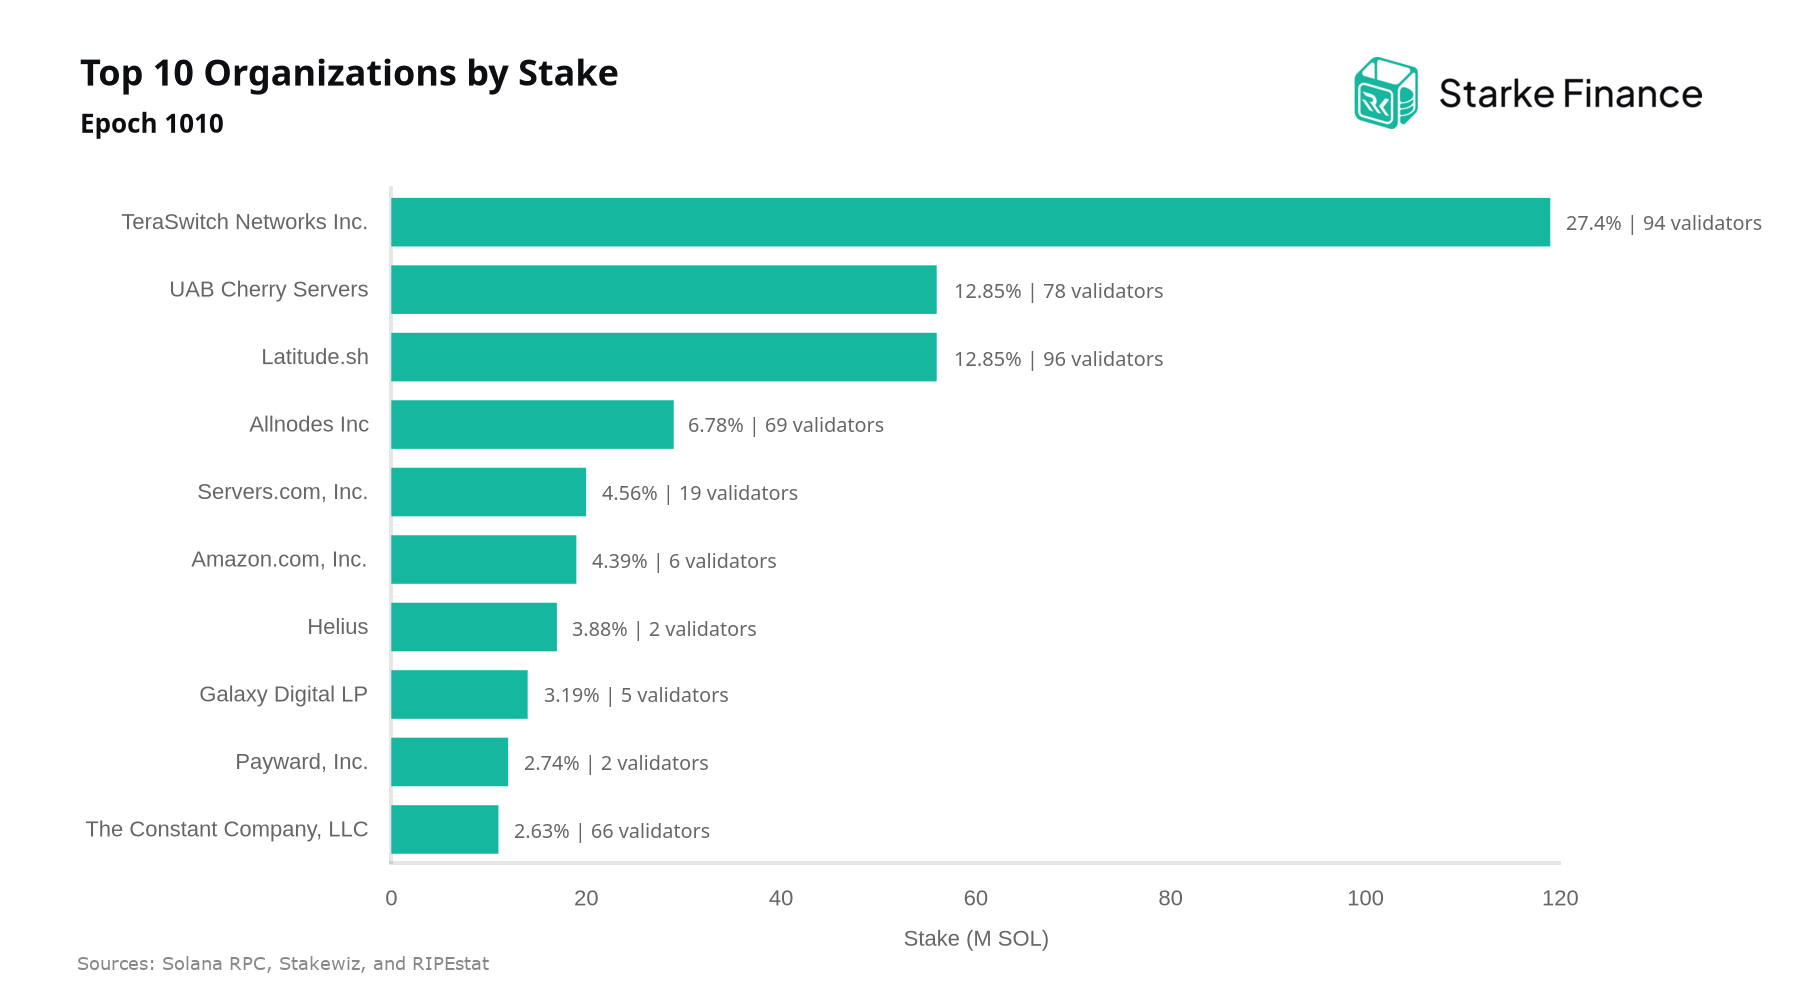
Top 10 Organizations by Stake
Organizational stake concentration among Solana's top validator operators remained structurally low over the last 15 epochs and continued to ease, with the Herfindahl-Hirschman Index falling from 1,337 to 1,232, a level well below thresholds typically associated with concentrated markets. Beneath the aggregate, rotation was pronounced: Priority Colo Inc recorded the largest inflow at +31,443.3%, while RockawayX Infra s.r.o. saw stake fall by 98.4%.
Maximize your Solana rewards with Starke Finance
- Higher yield potential: optimized validator selection built to capture more of Solana's staking rewards.
- Zero fees: we don't take a cut of your staking rewards.
- Transparency & control: track your stake and rewards in real time.
- Reliable infrastructure: institutional-grade validator operations built for uptime.
Disclaimer
This report is provided for informational purposes only and does not constitute investment, legal, or tax advice. Staking involves risk, including the risk of loss and slashing. Past performance is not indicative of future results. Please do your own research and consult a professional advisor before making financial decisions.
Contributors

Oscar GarciaFounder & CEO